Key points:
- Small- and mid-cap companies appear positioned for growth following a prolonged period of underperformance vs large-cap companies.
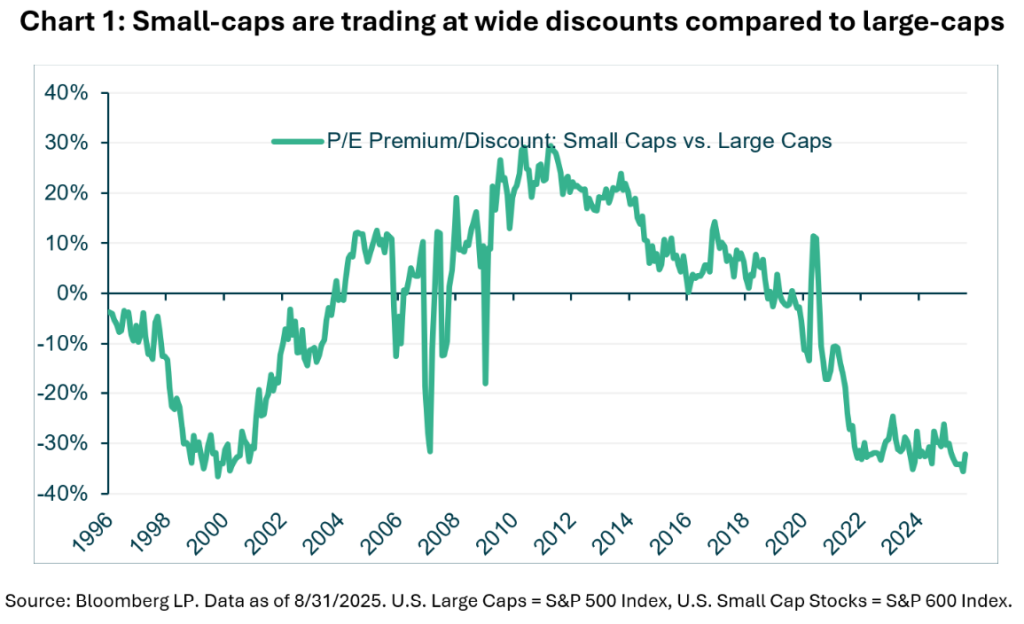
- The valuation gap between large-caps and small and medium companies is particularly wide as the S&P 500 trades at a high P/E vs long-term averages.
- Easing from the US Federal Reserve, attractive valuations and recovering earnings growth could be catalysts for future growth.
The US equity market continues to exhibit a tale of two parts: the mega-cap driven S&P 500, propelled by AI enthusiasm and global reach, versus the more domestically oriented small- and medium-cap universes, represented by the S&P 600 Small Cap and S&P 400 Mid Cap indices.
With market caps typically ranging from $850m to $5bn for small caps (S&P 600) and $5bn to $15bn for mid-caps (S&P 400), small and medium companies have traditionally offered investors higher growth prospects than their large-cap peers in return for taking on additional risk. But as chart 1 below illustrates, this relationship has not held in recent years as they have lagged behind large-cap companies, creating significant gaps in relative valuations and the potential future returns should these trends return to their long-term norms.
The attractiveness of small-caps is also amplified by several other factors, including their sensitivity to rate cuts from the US Federal Reserve, lower multiples relative to historical norms and large-cap peers, and recent positive performance that suggests a potential rebound. With monetary easing underway, we believe small- and mid-cap companies could be set to benefit.
Fed rate cuts: A tailwind for rate-sensitive small and mid-caps
Small- and mid-cap companies are more sensitive to interest rate fluctuations due to their reliance on debt financing. Unlike their large-cap peers, which often hold substantial cash reserves and have access to low-cost fixed-rate debt, smaller firms frequently carry floating-rate loans tied to benchmarks like the federal funds rate. This makes their interest expenses more volatile, squeezing margins when rates are hiked but unlocking significant relief when rates are cut.
The Fed’s move to resume monetary easing in September 2025 has already sparked optimism. Traders are now pricing in two additional 25-basis-point reductions by the end of 2025, with additional easing into 2026.
Relative valuation: Discounts that demand attention
Valuation metrics underscore the potential bargain in small and mid-caps, which, as the chart above illustrates, are currently trading at discounts to both historical norms and large-cap behemoths. This disparity reflects investor caution amid economic uncertainty, but positions these segments for multiple expansion as rates fall.
Valuation against history
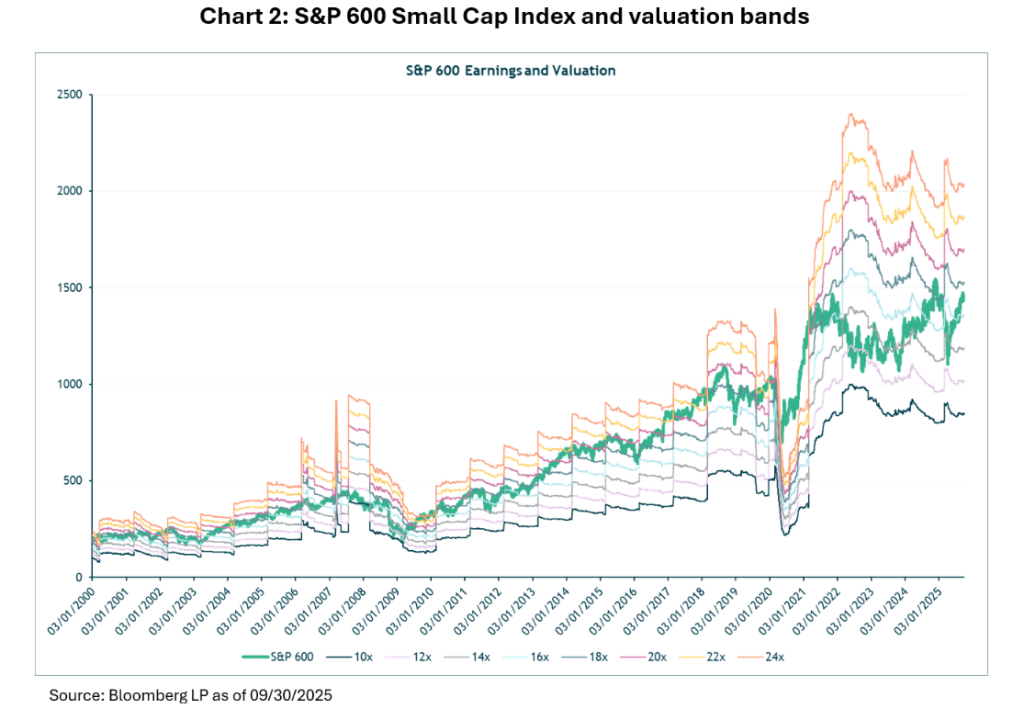
The S&P 600 Small Cap Index, which focuses on profitable small-cap firms, traded at a trailing P/E ratio of 15.9 as of 30 September 2025, slightly above its 10-year average of 14.5 but within one standard deviation (13.0-16.0). This compares favourably to its five-year average of 14.8, reflecting recovery from 2020’s earnings distortions. Chart 2 shows how the S&P 600 Small Index is trading near its long-term average, midway between extreme high and low valuations.
Meanwhile, the S&P 400 Mid Cap Index, with a trailing P/E around 16.5, sits below its 10-year average of 18.0, signalling undervaluation relative to its historical norm. Both indices are 15-25% below their late-1990s peaks, offering a margin of safety for investors anticipating economic stabilisation.
Valuation compared to large-cap companies
The valuation gap with large caps is striking. The S&P 500’s Price/Earnings ratio has climbed to 27.9 as of 30 September, a significant premium to its 25-year average of 18.6 and approaching dot-com bubble levels. In contrast, the S&P 600’s 15.7 P/E reflects a significant discount to the S&P 500.
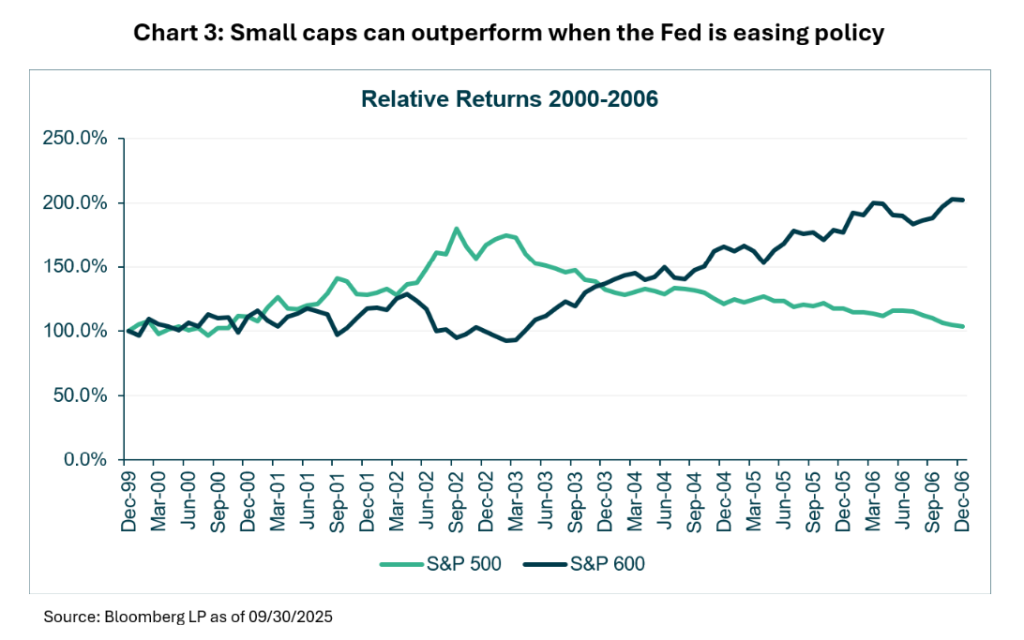
This gap, combined with expected earnings growth from rate cuts, mirrors the 2000-2006 period when small caps outperformed large caps by 99% amid Fed easing (as shown in chart 3).
Signs of a turnaround?
The recent performance of small and mid-caps reflects their cyclical sensitivity but also hints at a turning tide, especially against historical benchmarks.
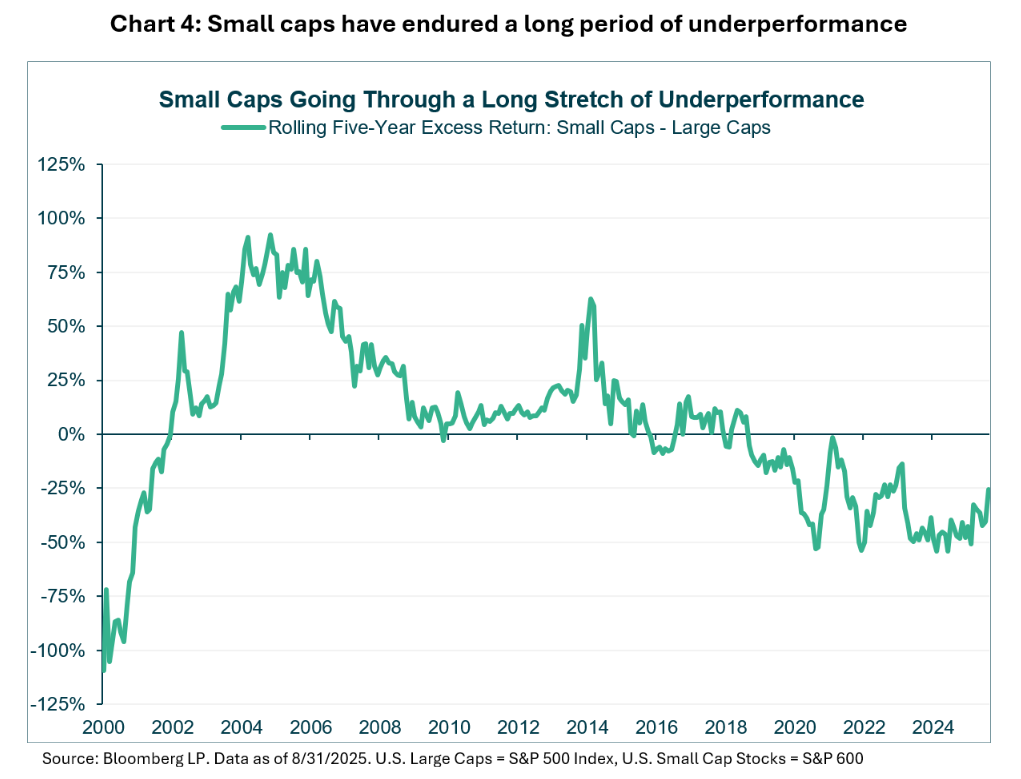
The S&P 600’s year-to-date net total return as of 30 September is approximately 4.2% in USD terms, following gains of 8.7% in 2024 and 16.1% in 2023. However, as chart 4 shows, smaller companies have significantly trailed their larger-cap peers for nearly two decades, a situation that has rarely persisted over longer time periods.
Recovering earnings
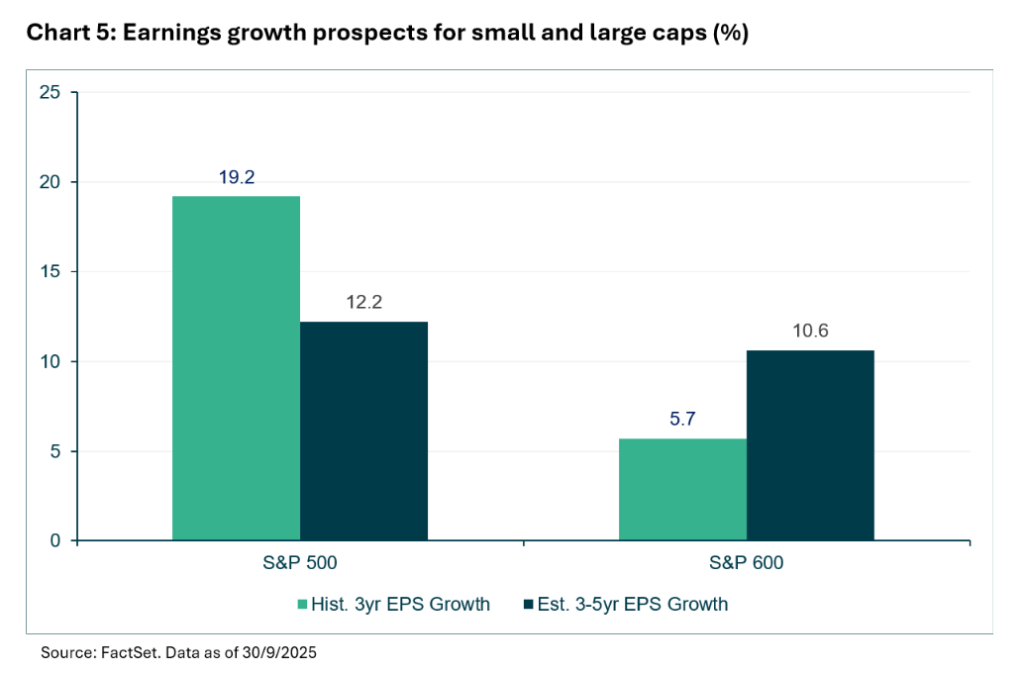
Smaller cap companies were hit hard during the Covid-19 pandemic, with the combination of profitability challenges and financial pressures resulting in a drop in earnings. By contrast, large-cap companies (helped by the mega-cap tech companies) produced EPS growth of just under 20% over the past three years (see chart 5).
These trends look set to reverse in the future, with S&P 600 earnings estimated to almost double over the next three to five years to just over 10%, in contrast to the S&P 500 which is predicted to normalise and fall to 12% growth. Given the large disparity in valuation between the two, and the Federal Reserve in easing mode, smaller cap companies could be set for a turnaround.
The iMGP US Small and Mid Company Growth Fund offers investors a strong option to access this market. Sub-advisors Polen Capital have appointed a new management team who brings with them a proven investment process and long track record. The team follow a fundamental, forward-looking process focused on identifying companies with key competitive advantages and positive business conditions. We feel the team’s dynamic investment process is particularly suited for today’s changing environment.