

The iMGP Low Duration Income Fund gained 1.67% in the fourth quarter, beating the Bloomberg Aggregate Bond Index (the Agg), which was up 1.10%, and the Bloomberg Aggregate 1-3 Year Index (1-3 Agg), which was up 1.18%. For the full year, the fund was up 7.37%, outpacing the Agg (+7.30%) and the 1-3 Agg (+5.39%).
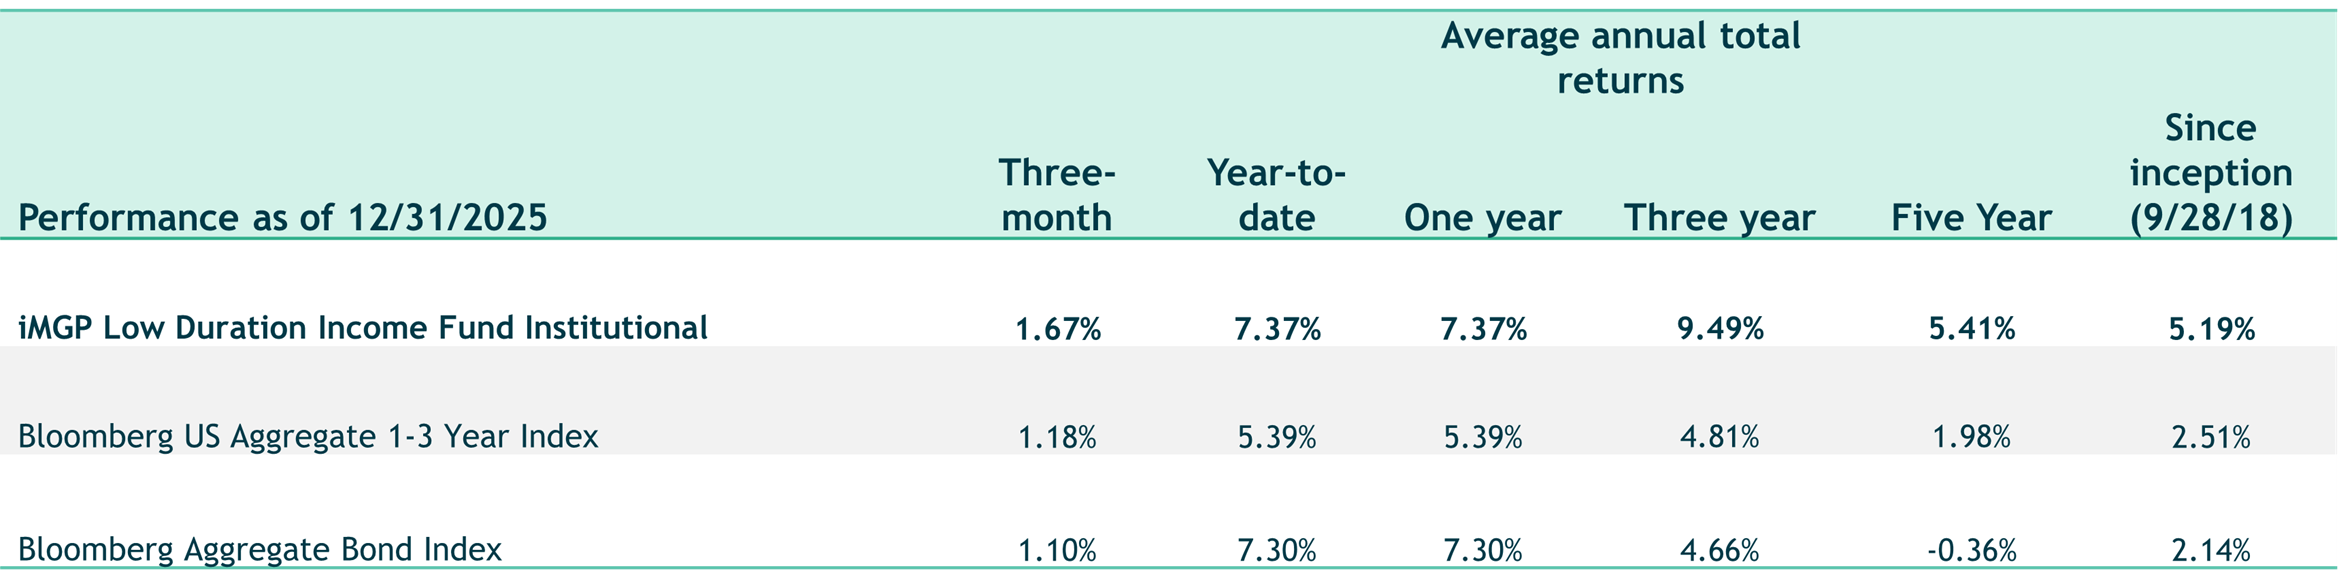
Past performance does not guarantee future results. Index performance is not illustrative of fund performance. An investment cannot be made directly in an index. The investment return and principal value of an investment will fluctuate so that an investor’s shares, when redeemed, may be worth more or less than their original cost. Current performance of the fund may be lower or higher than the performance quoted. To obtain the performance of the funds as of the most recently completed calendar month, please visit www.imgpfunds.com. Investment performance reflects fee waivers in effect. In the absence of such waivers, total return would be reduced.
For standardized performance click here: https://imgpfunds.com/low-duration-income-fund/
Quarterly Portfolio Commentary
Performance of Managers
During the fourth quarter, all three sub-advisors produced positive returns, with Guggenheim up 1.92%, Neuberger Berman up 0.82%, and BBH gaining 0.66%. (All sub-advisor returns are net of the management fees that each sub-advisor charges the fund.)* For the year, Neuberger Berman returned 15.03%, Guggenheim gained 11.62%, and BBH was up 4.47%.
Manager Commentaries
Brown Brothers Harriman
The portfolio’s duration profile was additive, as shorter-term rates had positive returns as the curve steepened. Sector and ratings exposures also contributed to performance modestly—with exposures from corporate credit holdings adding value. Selection hindered results as spreads were low and range-bound with little differentiation. Holdings of loans to chemical and technology companies, high yield bonds of technology companies, and collateralized loan obligations were among the detractors to selection. Holdings of loans to companies operating in the cable/satellite, retail, and electric utilities industries were additive to selection.
Credit issuance was generally strong, and markets have been open to issuers seeking to raise capital or refinance existing debt. Investment grade corporate bond volumes increased 4% year over year, ABS issuance was up 9%, and nonagency CMBS volumes surged 40% in 2025. High-yield bond volumes increased 9%, but loan volumes decreased 26% year over year.
One theme that permeated issuance across credit sectors was the increase in data center financing deals to fund the enormous demand for artificial intelligence (AI) infrastructure. The scale of issuance was notable: We estimate $300 billion of investment grade corporate bond volumes were tied to such projects in 2025, representing 16% of high-grade corporate issuance. We estimate that data center and fiber ABS issuances represented 8% of ABS volumes in 2025 (up from 4% in 2024) while data center SASB CMBS deals were 8% of nonagency CMBS volumes (up from 2% in 2024). These financings included both established and first-time issuers, various deal structures, and different levels of protection from equity or asset pledges. We believe our time-tested approach to identifying durable credit investments in such deals should help our client portfolios navigate potential volatility tied to AI headlines or risk events.
The U.S. economy proved resilient amid an eventful political landscape. Consumer spending remains strong, although there are concerns over a K-shaped economy forming from the divergence between the spending of higher- and lower-income consumers. Consumer sentiment indexes sit at weak levels, with concerns about high prices and a softening labor market weighing on consumers. Credit performance of consumer-related debt and loans suggest a “normalization” of credit losses – above the stimulus-induced lows of the recent past and well below those experienced in recessions. The resumption of payments on federal student loans has not yet had a meaningful impact on delinquencies in payments on other types of consumer debt, such as credit cards or auto loans.
U.S. business performance remains strong. The quarter began with fears that private credit losses could accelerate and reduce the returns in this recently popular segment of credit markets. For example, there were two significant defaults that arose from instances of fraud: Tricolor and First Brands. While the impact of those defaults was relatively contained, larger-scale concerns emerged regarding potentially relaxed lending standards. Equity of business development companies (BDCs) traded at a 10% discount to their net asset value, rivaling lows last experienced in 2023. In the fixed income markets, credit spreads on BDC debt widened marginally, while spreads on CLO debt were relatively stable.
Volatility is a feature of markets, and a built-in assumption and driver in our valuation process. We do not know what will cause the next bout of market volatility. Credit markets sit at a point of low to very low credit spreads in many major sectors. Periods of broadly unattractive credit valuations necessitate strong purchase and sale disciplines, a method of evaluating attractiveness of individual bonds, and careful selection accentuated by robust credit research. We are confident that credits owned in client portfolios meet our tests of durability while offering appropriate compensation for the risks assumed. Further, we believe our clients’ portfolios are positioned to navigate opportunities that arise when valuations become more appealing.
Guggenheim Investments
The economy has been resilient and has solid momentum heading into 2026. We expect real GDP growth around 2% for the year. Buoyant financial markets have created a wealth effect for consumer spending, particularly for high income households. AI-related investment has been a significant contributor to real GDP growth, even with official data likely understating the gains.
We expect some modest fiscal stimulus in the first half of 2026. A bounce back from the government shutdown could lift growth by over 1 percentage point. Retroactive tax cuts should deliver a sizable boost to tax refunds, supporting consumption in the first half of the year. Business provisions in the OBBBA should help lift investment, adding to tailwinds from AI capex. Growth should fade in the second half as fiscal stimulus wanes. At the same time, elevated productivity growth will support the supply side, helping the economy move into better balance.
Job growth has slowed substantially and is narrowly concentrated. The unemployment rate has trended up, though we see this as more about low hiring than rising layoffs. While a continued move higher in unemployment is a key risk to the outlook, our base case anticipates unemployment stabilizing around 4.5%.
We see some potential for inflation to stay sticky to start 2026, driven by seasonal patterns and further tariff pass through. Later this year, tariff pass through should fade, and disinflation should resume with falling rent inflation and lower wage growth. We see core inflation around 2.5% YoY by end-2026, with sequential measures closer to the 2% target.
With growth expected to get a boost from fiscal policy in early 2026 and some stickiness in inflation, along with data quality questions after the government shutdown, we expect the Fed will pause for the next few meetings to see how the economy evolves. We expect further cuts by the middle of the year as disinflation resumes, taking the fed fund rates to neutral by the end of the year, which we see as 3-3.25%. The Fed will transition to a new Chair this year, which may shift the tone of monetary policy deliberations. The new Chair will operate as part of a broader Committee and if the institutional framework remains intact, as we expect, economic fundamentals will remain the most salient driver for the Fed’s rate outlook.
Demand for fixed income remains healthy given attractive all-in yields. However, technical tailwinds may ease this year as a re-leveraging cycle brings the strongest net supply of credit issuance seen in years, making selectivity vital with tight spreads posing risks to excess returns. Corporate fundamentals continue to look strong and are supported by steady earnings growth, which is keeping rating migration balanced and defaults rates low.
Our positioning prioritizes diversification and income generation. We prioritize high carry instruments, including non-agency residential mortgage-backed securities, senior collateralized loan obligations, and commercial asset-backed securities. We also see value in high-quality sectors like structured credit and in defensive assets like infrastructure. We continue adding to Agency RMBS where spreads remain relatively attractive and offer the potential for additional price upside from falling interest rate volatility and/or policy changes that could spur further buying.
Neuberger Berman
Equity Markets
2025 will be remembered less for where markets finished and more for the route they took to get there. What began with tariff shock, one of the sharpest volatility spikes since 2020, and a near‑bear‑market drawdown ultimately resolved into a surprisingly constructive finish for global equities. The S&P 500 Index advanced 2.65% in the fourth quarter and 17.88% for the full year, even as investors spent much of the year debating whether the next move would be a hard landing, a soft landing, or no landing at all.
Beneath the surface, though, 2025 was anything but smooth. While the S&P 500’s peak‑to‑trough drawdown approached -19%, the average constituent stock saw a maximum drawdown closer to -27%, underscoring “massive churn and volatility” at the individual stock level. Leadership remained highly concentrated as well. Over the past three years, the so‑called “Magnificent 7” drove 55% of the S&P 500’s total return; in 2025 specifically, the index’s 17.9% gain would have been closer to 10.4% without them.
Fixed Income
Fixed income in 2025 was steadier than the headlines suggested, quietly compounding carry while the debate raged elsewhere. The Federal Reserve delivered a total of 75 basis points of cuts over the year, including a 25 basis point move in December, bringing the federal funds target range to 3.50%-3.75% by year‑end. Futures markets assigned only a modest probability of roughly 16% to a fourth consecutive cut at the January 2026 meeting, signaling that investors see the Fed closer to a cruising altitude rather than just lifting off from restrictive territory.
Core fixed income delivered solid results. The Bloomberg US Aggregate Bond Index returned 1.10% in the fourth quarter and 7.30% for 2025, despite a modest 15 basis points decline in December. Credit markets were somewhat stronger, helped by lower policy rates, manageable default rates, and a renewed search for income: the Bloomberg U.S. Corporate High Yield Index returned 1.31% in the fourth quarter and 8.62% for the year, with December contributing 0.57%.
Option Implied Volatility Indexes
Volatility in 2025 delivered a bit of everything: a sudden shock, a long normalization, and a year‑end landscape that looks almost tranquil if you ignore the path that got you there. The Cboe Volatility Index (VIX) averaged the year at 19 and ending at its low point of 13 at the end of December. That calm endpoint, however, obscures the fact that VIX spiked to 60.13 on April 7 amid tariff‑driven risk‑off trading, one of the largest volatility shocks since the COVID crisis.
The more telling story for our strategies, however, sits in the implied volatility risk premium—the margin between implied volatility and the realized volatility subsequently delivered by the underlying markets. For U.S. equities, that margin stayed positive: the average 30‑day implied‑minus‑realized premium was about 2.9 points for the year and a more robust 5.3 points in the fourth quarter alone.
Outlook
Looking ahead, the message from volatility markets is more nuanced than the low spot VIX might suggest. While spot levels have drifted back into the low‑ to mid‑teens, VIX futures continue to price volatility closer to long‑run norms over the coming year rather than a regime of persistent calm. In other words, it appears markets are treating today’s low readings as a temporary lull, not a new equilibrium, and are still assigning a reasonable probability to bouts of elevated volatility in 2026. For option strategies, the backdrop of low spot, term structure pointing back toward “normal” uncertainty is generally constructive. In our view, option strategies are largely being paid to underwrite risk in an environment that remembers the recent shock, even if it is not currently trading like the next one is right around the corner.
Strategy Allocations
The fund’s target allocations across the three managers are as follows: 40% each to Brown Brothers Harriman and Guggenheim Investments, and 20% to Neuberger Berman. We use the fund’s daily cash flows to bring each manager’s allocation toward their targeted allocation should differences in shorter-term relative performance cause divergences.
Sub-Advisor Portfolio Composition as of December 31, 2025
Brown Brothers Harriman Credit Value Strategy
| ABS | 8.5% |
| Bank Loans | 26.7% |
| Corporate Bonds | 57.3% |
| CMBS | 2.2% |
| Cash & Equivalents | 1.6% |
Guggenheim Multi-Credit Strategy
| ABS | 30.8% |
| Bank Loans | 14.8% |
| Corporate Bonds | 23.1% |
| CMBS (Non-Agency) | 1.7% |
| Preferred Stock | 2.8% |
| RMBS (Agency) | 3.3% |
| RMBS (Non-Agency) | 16.6% |
| Other | 6.9% |
Neuberger Berman Option Income Strategy
|
*
| Management Fees | 0.85% |
| Distribution and or Service (12b-1) Fees | None |
| Other Expenses | 0.35% |
| Interest and Dividend Expenses | 0.00% |
| Total Other Expenses | 0.35% |
| Total Annual Fund Operating Expenses: | 1.20% |
| Fee Waiver and/or Expense Reimbursement: | (0.22)% |
| Gross Expense Ratio | 1.20% |
| Net Expense Ratio | 0.98% |
The Advisor has contractually agreed to limit the expenses through 4/30/2026.
- Share Article:
- Tweet
- Share
- Share on Facebook
- Copy link Copied to clipboard
iMGP Fundsʼ investment objectives, risks, charges, and expenses must be considered carefully before investing. The prospectus contains this and other important information about the investment company, and it may be viewed here or by calling 1-800-960-0188. Read it carefully before investing.Must be preceded or accompanied by a prospectus. Read it carefully before investing.
Although the managers actively manage risk to reduce portfolio volatility, there is no guarantee that the fund will always maintain its targeted risk level, especially over shorter time periods and loss of principal is possible. The performance goals are not guaranteed, are subject to change, and should not be considered a predictor of investment return. All investments involve the risk of loss and no measure of performance is guaranteed. The fund aims to deliver its return over a full market cycle, which is likely to include periods of both up and down markets.
Dividends, if any, of net investment income are declared and paid monthly. The Fund intends to distribute capital gains, if any, to shareholders on a quarterly basis. There is no assurance that the funds will be able to maintain a certain level of distributions. The fund is newly organized with no history of performance.
Though not an international fund, the fund may invest in foreign securities. Investing in foreign securities exposes investors to economic, political and market risks, and fluctuations in foreign currencies. Investments in debt securities typically decrease when interest rates rise. This risk is usually greater for longer-term debt securities. Investments in mortgage-backed securities include additional risks that investor should be aware of including credit risk, prepayment risk, possible illiquidity, and default, as well as increased susceptibility to adverse economic developments. Investments in lower-rated and non-rated securities present a greater risk of loss to principal and interest than higher-rated securities. Derivatives may involve certain costs and risks such as liquidity, interest rate, market, credit, management, and the risk that a position could not be closed when most advantageous. Investing in derivatives could lose more than the amount invested. The fund may invest in master limited partnership units. Investing in MLP units may expose investors to additional liability and tax risks. Multi-investment management styles may lead to higher transaction expenses compared to single investment management styles. Outcomes depend on the skill of the sub-advisors and advisor and the allocation of assets amongst them. The fund may make short sales of securities, which involves the risk that losses may exceed the original amount invested. Merger arbitrage investments risk loss if a proposed reorganization in which the fund invests is renegotiated or terminated.
Diversification does not assure a profit nor protect against loss in a declining market.
Leverage may cause the effect of an increase or decrease in the value of the portfolio securities to be magnified and the fund to be more volatile than if leverage was not used.
Mutual fund investing involves risk. Principal loss is possible.
iM Global Partner Fund Management, LLC has ultimate responsibility for the performance of the iMGP Funds due to its responsibility to oversee the funds’ investment managers and recommend their hiring, termination, and replacement.
iMGP Funds are distributed by ALPS Distributors Inc. LGM001443 exp 3/31/2028.