Scope and methodology
This research note presents Sirios Capital Management’s investment philosophy and its long/short equity expertise since 1999. It was prepared by the Research & Investment and Asset Management teams at iM Global Partner (“iMGP”).
The quantitative analysis is based on the historical returns of Sirios Capital Partners II, L.P. (Net) (“Sirios Long/Short Strategy” hereafter). “Net” returns represent returns after expenses, a 1% model management fee and a 20% model incentive allocation, accrued for the current year, if applicable. This fund is not registered for marketing in the European Union. The mention is only made to illustrate the purpose of the present document and it does not in any way constitute an offer, investment advice, or a recommendation to buy or sell shares in any investment fund’s units. Investors are advised to consult their legal, financial or tax advisors before making any investment decisions.
Performance is assessed against the S&P 500 Net Total Return Index (the “S&P 500 Index” hereafter) and the HFRX Equity Hedge Index (the “HFRX HF Index” hereafter), an investable benchmark composed of long/short equity hedge funds reporting returns net of all fees. The analysis is conducted by iMGP using monthly data from July 1999 to March 2026. Data are extracted from eVestment, Morningstar and Kenneth R. French database. This document was prepared without input from, or endorsement by, Sirios Capital management.
Firm overview and investment approach
Founded in 1999, Sirios Capital Management is an entrepreneurial, Boston-based (MA, USA) equity investment firm, registered with the SEC. The firm is primarily owned by its founder, John F. Brennan Jr., as well as indirectly by its most senior employees, who are meaningfully invested alongside clients.
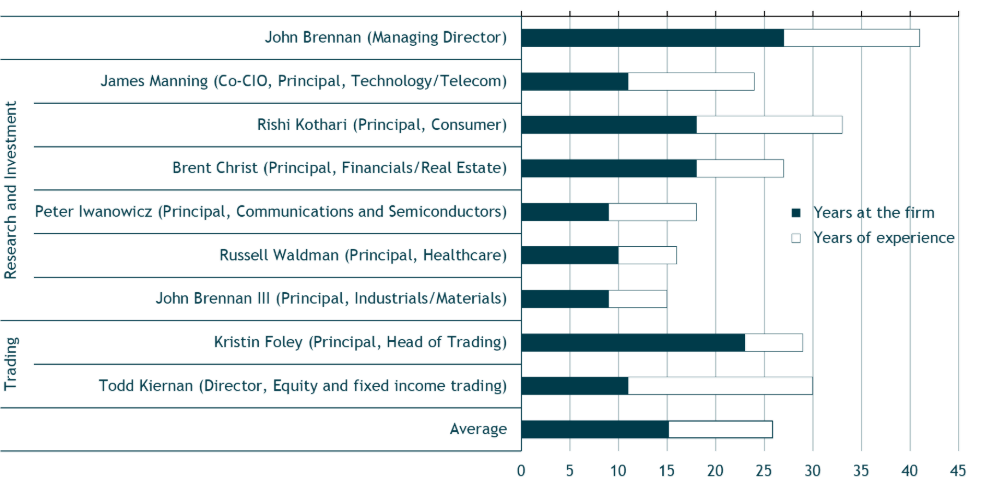
The firm’s investment approach is fundamentally bottom-up, focusing on growth-oriented companies with valuation discipline on the long side, and on companies with weak balance sheets and deteriorating fundamentals and/or valuations on the short side. The firm has 14 employees, including an investment team of seven professionals and a trading team of two. Together, they average over 25 years of experience (including 15 at Sirios) and have worked together for a decade.
The investment team is structured along sector lines, with each professional specializing in specific industries and responsible for coverage and stock selection within their domain, under the leadership of John F. Brennan Jr. This allows Sirios to benefit from both portfolio management skills, as it invests globally across sectors, and the fundamental advantage of their focus within each sector. Sector analyst teams cover around 200 stocks per broad sector grouping.
Figure 1: Sirios investment & trading team
Their investment universe is comprised of US companies with selective exposure to Europe and Asia, and with a minimum market cap of $1 billion, approximated by the Russell 1000. The long book is split into ‘core’ and ‘catalyst’ positions. Core positions (2+ year investment horizon) are the highest conviction ideas and are usually held at higher individual weightings than catalyst positions (6-18-month investment horizon). When considering potential new positions, or reviewing existing positions, Sirios employs an intrinsic value approach driven by the fundamental, bottom-up analysis of growth in earnings and cash flow based on Sirios’s proprietary models.
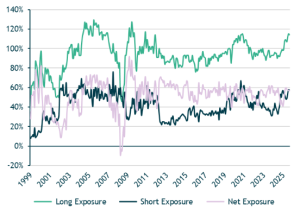
Figure 2: Historical equity exposure
Performance is primarily driven by stock selection, which remains at the core of the strategy. At the same time, the team actively manages net exposure and has demonstrated flexibility across market cycles. Figure 2 shows that since inception, the Sirios Long/Short Strategy has had an average net equity exposure of 52%, with 94% long and 41% short exposure. However, these averages mask significant variations over time.
The team has used this flexibility to adjust positioning as market conditions evolve, including turning net short during the Great Financial Crisis, when their bottom-up approach led them to grasp the deterioration of fundamentals and of market conditions.
Comparative analysis of Sirios long/short strategy track record
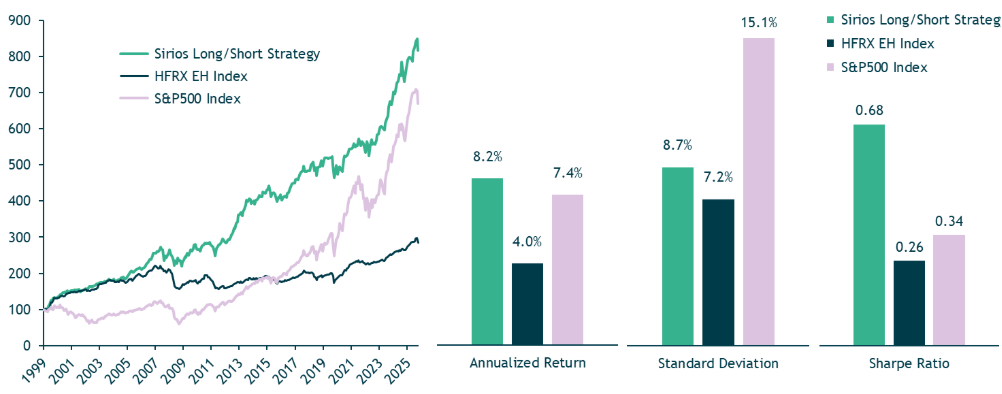
Launched in July 1999, the Sirios Long/Short Strategy has delivered an annualized return of 8.2% with a volatility of 8.7% through the end of March 2026. This performance is slightly above that of the S&P 500 (7.4%), despite the index exhibiting nearly twice the volatility (15.1%), and more than double that of the HFRX index (4.0%), whose volatility is broadly comparable (7.2%). Therefore, the strategy’s Sharpe ratio (0.68) stands at roughly twice the S&P level (0.34) and more than double the HFRX EH (0.26).
Figure 3: Cumulative performance (left chart) and standard risk/return metrics (right chart)
Calendar‑year returns highlight a consistent pattern of outperformance versus the HFRX EH Index and resilient behavior in more challenging market environments. The strategy has repeatedly shown strong downside protection, for example in 2008 (14.0% vs. ‑25.5% for the HFRX EH Index and ‑37.4% for the S&P 500 Index) and in 2022 (-2.8% vs. -3.2% and -18.5% respectively).
In stronger markets, the strategy participates in the upside, though to a lesser extent than the S&P 500 Index, as seen in 2019 (+10.6% vs. +30.7%) and 2021 (+9.2% vs. +28.2%), consistent with its lower net‑exposure profile. Certain years, such as 2013 (+29.0% vs. 11.1% for the HFRX EH Index) and 2023 (+12.7% vs. +5.8%), highlight meaningful alpha generation.
Overall, the pattern points to an asymmetric return profile that combines meaningful downside protection with consistent relative performance, a conclusion that will be explored in greater detail later in the document.
Figure 4: Calendar year performances
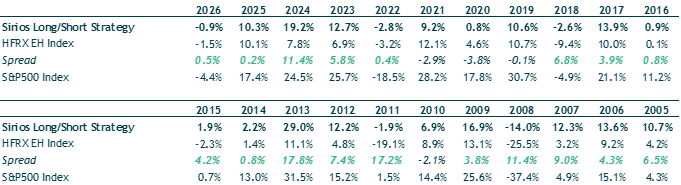
Figure 5: Rolling 3-year Sharpe ratios
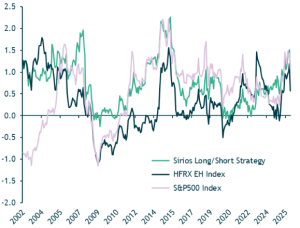
The strategy’s rolling three‑year Sharpe ratio remains positive for the vast majority of the period, indicating that episodes of underperformance relative to the risk-free rate have been infrequent and typically short-lived.
It also exceeds the Sharpe ratio of the HFRX Equity Hedge Index most of the time and often compares favorably with that of the S&P 500 Index.
The strategy exhibits significantly better drawdown characteristics than both the HFRX Equity Hedge Index and the S&P 500. The average duration of maximum drawdown is materially shorter, at 3.6 months for the strategy compared to 9.3 months for the HFRX EH Index and 6.9 months for the S&P 500 Index. In addition, drawdowns are substantially less severe, with a maximum drawdown of -19% for the strategy versus -30% for HFRX EH Index and -51% for the S&P 500 Index. As a result, the Calmar ratio is three times higher for the strategy, at 0.42 compared to 0.14 for both indices.
Figure 6: Drawdown analysis
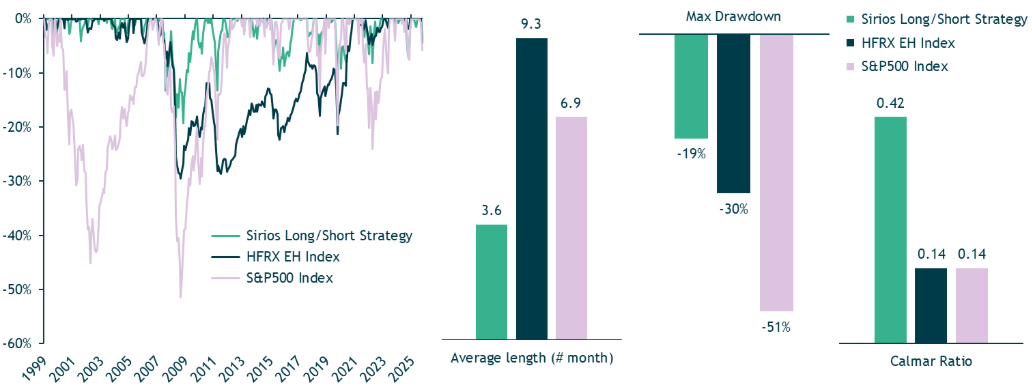
Figure 7: Empirical monthly return distribution vs. volatility-matched Normal distribution
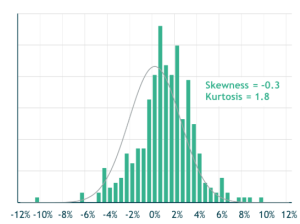
Beyond the first two moments of the return distribution (average return and volatility) which were discussed above, the higher moments remain close to those of a normal distribution.
Skewness (–0.3) and kurtosis (1.8) remain close to the ones of a normal distribution (respectively 0 and 3), with skewness (the third‑order moment) capturing return asymmetry and kurtosis (the fourth‑order moment) reflecting the frequency of extreme positive or negative returns. This indicates that the strong return highlighted above is not driven by excessive or highly asymmetric risk-taking, as can be the case for certain hedge fund strategies.
Figure 8: Performance decomposition across equity market regimes
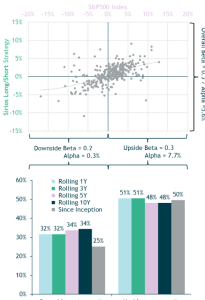
The strategy exhibits an asymmetric beta profile relative to the S&P 500 Index. Its conditional beta is lower in down markets (0.2) and rises to 0.3 in up markets, resulting in an unconditional beta of 0.3. This convex exposure supports capital preservation in equity market drawdowns while maintaining significant participation in rising markets.
The annualized alpha relative to the S&P 500 Index is significant (5.6%) and has been generated predominantly during bullish market phases (7.7%), while still delivering a positive, albeit modest, contribution in down markets (0.3%).
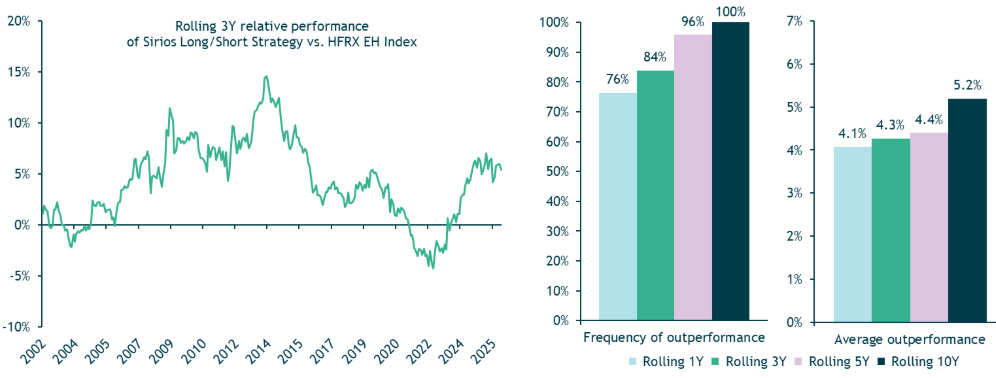
As a result, the strategy exhibits a favorable asymmetry in equity capture ratios, participating in roughly half of the market upside while limiting downside capture to about one-third, consistently across time horizons (1, 3, 5, and 10-year).
The strategy’s rolling 3-year relative performance versus the HFRX EH Index has ranged between -4.3% and 14.5%, remaining positive for most of the period. This translates into high and increasing outperformance frequency and magnitude as the investment horizon lengthens.
Figure 9: Relative performance vs. HFRX EH Index
A factor-based analysis of the strategy’s gross performance, using factors from Kenneth French’s data library, enables a more refined decomposition of returns into contributions from the risk-free rate, dynamic beta exposure, and pure alpha generation driven by stock selection. Whether under a CAPM framework (market factor only) or the Fama-French-Carhart six-factor model (market, size, value, momentum, profitability, and investment), both market beta exposure and alpha generation exhibit a high degree of consistency over time.
Figure 10: Factor-based decomposition of strategy returns
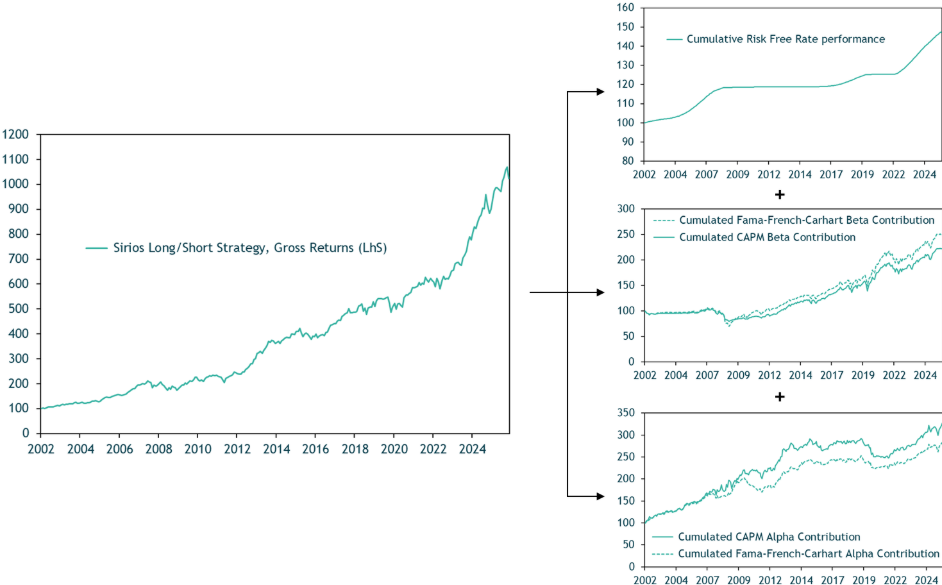
Figure 11: US equity market implied volatility and equal-weighted cross-section monthly dispersion
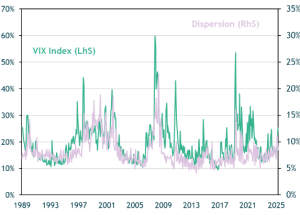
In the second half of the 2010s, the plateau in alpha generation should be interpreted in the context of an exceptionally low-dispersion, low-volatility market environment. During this period, cross-sectional return dispersion across US stocks was compressed, mechanically limiting the opportunity set for stock picking.
By contrast, the more recent period has been characterized by a meaningful increase in dispersion, accompanied by stronger alpha generation, suggesting that the strategy has effectively captured the richer opportunity set available.
Over a 26-year period, the evidence indicates a consistent ability to combine efficient dynamic beta management with sustained alpha generation. This combination has enabled the strategy to mitigate equity market downturns while effectively participating in rising markets, leading to a track record that reflects a genuinely asymmetric upside return profile. Alpha has been a durable and recurring feature, consistent across both simple and multi-factor analytical frameworks. Renewed alpha generation in higher dispersion environments supports the view that Sirios’s results stem from a repeatable and robust investment process. As such, the strategy stands out as a differentiated long/short equity approach capable of delivering durable performance across diverse market conditions.
Disclaimer
This research note is issued on a confidential basis and for professional investors only, by iM Global Partner SAS (hereinafter “iM Global Partner”), a French company domiciled at 20 rue Treilhard, F-75008 Paris (France), supervised and authorized by the Autorité des Marchés Financiers under number 6925760 as a portfolio management company.
By accepting delivery of this research note, you agree that you will keep confidential all information contained within it and will not disclose any such information to any person without the prior consent of iM Global Partner (provided that you may disclose this research note, on the same confidential basis, to your legal, tax or financial advisers for the purposes of obtaining advice, financing sources or to your officers and employees and those of affiliated companies). The information contained herein is being furnished for discussion purposes only and may be subject to completion or amendment through the delivery of additional documentation.
This research note does not constitute solicitation, offer or recommendation to buy or sell any security or other financial instrument or product. Furthermore, any reference to a specific security in this document should not be construed as a recommendation or investment advice. This is not a contractually binding document, or an information document required by law. It is not intended for distribution to or use by individuals or legal entities that are citizens of or reside in a state, country or jurisdiction in which applicable laws and regulations prohibit its distribution, publication, issue or use. Users are solely responsible for verifying that they are legally authorized to consult the information herein.
Furthermore, the information contained herein (including historical prices, flows or values) has been obtained from sources that iM Global Partner considers to be reliable; however, iM Global Partner makes no representation as to, and accepts no responsibility or liability for, the accuracy or completeness of the information contained herein. Such information is presented as of the date and, if applicable, time indicated. iM Global Partner does not accept any responsibility for updating any such information. It may be revoked or changed without prior notice.
The information contained herein on past performance should not be taken as an indication or guarantee of future performance, and no representation or warranty, express or implied, is made regarding future performance. Performance is calculated in the unit currency and, when investments are made in a different currency, it may also be affected by fluctuations in exchange rates.
Any projections, valuations, and statistical analyses contained herein have been provided to assist you in the evaluation of the matters described herein. Such projections, valuations, and statistical analyses are subject to unexpected risks and uncertainties, are not to be viewed as facts, and should not be relied upon as an accurate representation of future events. Accordingly, no representation or warranty, express or implied, is made regarding future events.
iM Global Partner is not an adviser as to legal, taxation, accounting, regulatory or financial matters in any jurisdiction and is not providing any advice as to any such matter. Investors are advised to consult their legal, financial or tax advisors before making any investment decisions. Tax treatment depends entirely on the financial situation of each investor and may be subject to change. It is recommended that investors obtain the appropriate expert advice before taking any investment decisions.
Any investment program involves a high degree of risk and is suitable only for certain investors. iM Global Partner makes no representations as to the suitability of any of the strategies mentioned for any investor. You acknowledge that you will conduct your own independent financial, business, regulatory, accounting, legal and tax investigations with respect to the accuracy, completeness, and suitability of this information, should you choose to use or rely on this document, at your own risk, for any purpose.