Introduction
Trinity Street Asset Management (“TSAM”)’s international equity strategy is built around a style-agnostic investment philosophy focused on identifying companies undergoing positive under-recognised structural change. Rather than relying on exposure to traditional equity styles, the strategy seeks to generate alpha through bottom-up stock selection driven by company-specific transformations.
This paper empirically assesses whether the strategy’s realised risk profile is consistent with its stated investment philosophy. Using the Fama–French–Carhart (“FFC”) framework, we first analyse the magnitude and stability of the strategy’s factor exposures over time. We then decompose active risk into systematic factors and idiosyncratic components, before comparing TSAM’s positioning with that of the broader eVestment international equity universe. Finally, we examine the relationship between the strategy’s active risk profile and its diversification characteristics through an analysis of pairwise excess return correlations across peer strategies and market regimes.
Overall, the analysis suggests that TSAM’s active risk profile is predominantly idiosyncratic, with limited dependence on traditional equity factors and stronger diversification characteristics than those of the average international equity manager.
TSAM investment philosophy: Focusing on companies undergoing positive structural under-recognised change, leading to a style-agnostic approach
Founded in 2002 by Richard Bruce, TSAM is a $10bn international and global equities specialist based in London. The firm has built its identity around a concentrated, opportunistic and fundamentally driven philosophy that targets companies undergoing positive structural under-recognised change.
The investment team consists of global generalists and has been stable through time, with the average tenure at the firm nearing 10 years. The team’s experience has been built up over multiple cycles, in different market environments notably including outside the US, in Europe, Japan and other parts of Asia. Investment ideas emerge through extensive in-person meetings with management as well as with the target’s supply chain. This informs the team’s views regarding the potential for rapid and fundamental shifts in companies, industries or regions as powerful disruptors of market pricing. Examples of catalysts include changes in company management or strategic roadmap, strong shifts in supply/demand balances for a firm’s products, or changes in competitive landscapes. Structural changes may be under-recognised due to historical bias, short-term pricing, lack of global perspective, and are accordingly not limited to idiosyncratic company changes, but may also extent to industry or regional changes. TSAM defines “under-recognised change” as structural improvement whose impact is not yet fully captured by consensus earnings expectations or market valuation. The team validates this gap by building proprietary earnings forecasts, testing them with company management, and comparing them with market consensus. A position is initiated only when this perceived mispricing creates significant absolute upside to intrinsic value.
Because structural change can occur across companies irrespective of their factor characteristics, TSAM’s opportunity set is not inherently tied to any specific investment style. As a result, the strategy may offer meaningful diversification benefits relative to the broader universe of active strategies, which often display significant factor tilts. However, this ultimately depends on whether the portfolio indeed exhibits limited factor exposures and allocates a significant share of its active risk to idiosyncratic positions.
TSAM’s strategy exhibits limited but economically consistent factor exposures
Methodology for estimating factor exposures
We first investigate the exposure of the strategy’s returns to common equity risk factors. To this end, we estimate multiple regressions of the Trinity Street Global Equity EAFE/International Composite returns (source: eVestment) on factor returns from the FFC 6-factor model for developed ex-US markets (source: Kenneth R. French Data Library). The regressions are performed using monthly data over rolling three-year windows. The analysis covers the period from January 2004 to December 2025.
We favour the FFC framework because it provides a parsimonious and empirically robust representation of the main systematic drivers of equity returns, in contrast to commercial risk models built on increasingly expansive sets of factors, many of which may lack statistical robustness or economic persistence. Appendix 1 reviews the academic foundations of the model, while Appendix 2 provides a detailed description of the construction methodology underlying the FFC portfolios. The market factor is proxied by the strategy’s benchmark, the MSCI EAFE Net Dividend Index (source: eVestment).
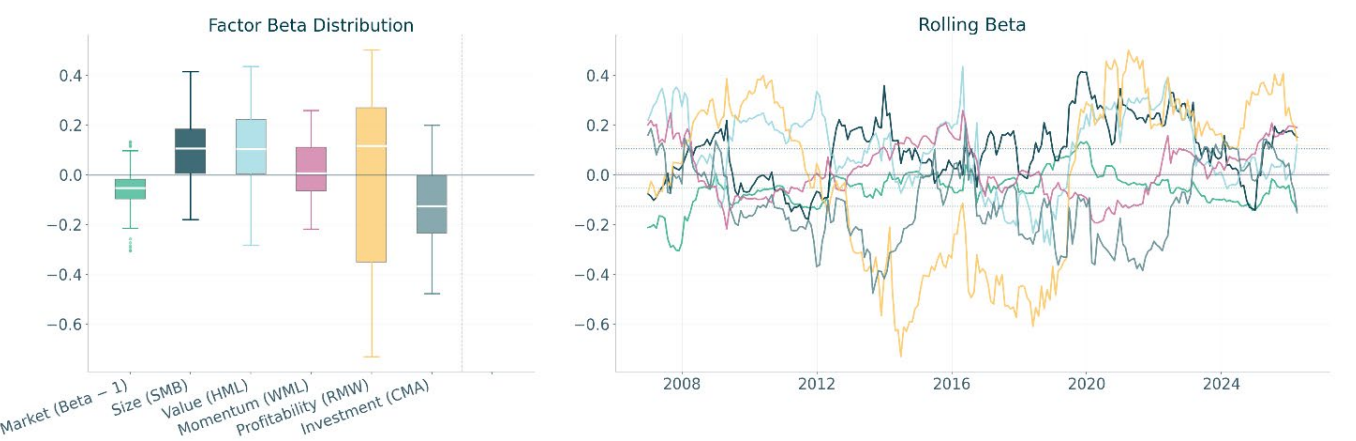
The right panel of Figure 1 shows the historical evolution of the strategy’s factor betas (solid lines), together with their full-sample averages (dotted lines). The market beta is reported in excess of 1 to indicate periods of over- or under-exposure to the benchmark. Box plots in Figure 1 show the distribution of factor exposures, with the central white line representing the median and the box indicating the interquartile range (from the 25th to the 75th percentile). The whiskers extend to the most extreme observations within 1.5 times the interquartile range, capturing the typical spread of the data.
Figure 1: Factor beta analysis of TSAM’s international equity strategy

Evidence of limited factor exposures
The results broadly support TSAM’s claim of maintaining a style-agnostic investment approach. Factor exposures remain limited throughout the sample period, with median rolling betas ranging from –0.13 for the investment factor (CMA) to approximately +0.10 for the size (SMB), value (HML), and profitability (RMW) factors, while remaining close to zero for momentum (UMD).
Some modest structural factor exposures consistent with TSAM’s investment philosophy
The analysis nevertheless reveals several modest but persistent factor tilts that appear economically consistent with TSAM’s investment philosophy. In particular, the strategy exhibits small positive exposures to the size and value factors, together with a negative exposure to the investment factor.
The slight positive loading on the size factor likely arises mechanically from an investment philosophy that treats each stock as an individual opportunity, regardless of its market capitalisation. Compared with a cap-weighted benchmark dominated by large-cap names, this naturally produces a modest tilt toward smaller companies. This effect might be further reinforced by the fact that under-recognised structural change may be more prevalent among smaller and less efficiently covered companies.
The modest positive exposure to the value factor may reflect the tendency for under-recognised structural change to generate temporary valuation dislocations. Companies undergoing positive transformation may trade at depressed valuations until improvements in earnings potential and long-term fundamentals become more fully reflected in market expectations.
Finally, the small negative exposure to the investment factor may reflect the tendency of companies undergoing structural change to allocate capital toward business transformation, capacity expansion, or longer-term strategic development before the associated improvement in fundamentals becomes fully
incorporated into market valuations.
Low time variation in factor exposures, except for profitability
Most rolling factor betas fluctuate within relatively narrow ranges around their long-run averages, suggesting that the strategy maintains a broadly stable factor profile over time. The only notable exception concerns the profitability factor (RMW), whose exposure exhibits somewhat greater variability. This likely reflects the nature of TSAM’s investment process, which can lead to the strategy to invest both in companies undergoing structural transformation with temporarily depressed profitability and in firms already exhibiting improving earnings quality. The variability of the estimated RMW exposure may also be amplified by the time-varying correlations between profitability, value, and investment factors within rolling multifactor regressions.
Limited factor exposures translate into a predominantly idiosyncratic component of TSAM’s active risk relative to its benchmark
From factor exposures to active risk decomposition
Rolling factor betas provide a widely used indication of the strategy’s factor tilts. However, they do not indicate how much risk a given exposure represents and they are not directly comparable across factors, because the underlying FFC factor portfolios – although all constructed on a similar +/-100% long–short basis (see appendix 2) – can exhibit markedly different volatilities and pairwise correlations (see appendix 3).
Moreover, factor betas provide only a partial representation of the strategy’s risk profile, as they do not capture the component of risk that lies outside factor exposures.
We therefore complement the factor exposure analysis by decomposing active risk (i.e., tracking-error) into systematic factors and residual (or idiosyncratic) components, thereby explicitly incorporating factor volatilities, cross-factor correlations, and idiosyncratic risk within a unified framework. Appendix 4 provides a comprehensive presentation of the underlying methodology. As with the estimation of rolling factor betas, all other model inputs are estimated over rolling three-year windows using monthly data between January 2004 and December 2025.
Active risk is predominantly idiosyncratic
The right panel of Figure 2 shows the historical evolution of the contributions of systematic factor exposures and idiosyncratic risk to the strategy’s tracking-error (solid lines), together with their full-sample averages (dotted lines). Only the market beta in excess of 1 is considered when estimating the contribution of the market factor, since the relevant source of active market risk is the strategy’s over- or under-exposure relative to the benchmark. For each observation date, the contributions sum to 100% of total tracking error. Box plots in Figure 2 show the distribution over time of the contribution of each component – factor exposures and idiosyncratic risk – to the tracking-error, following the same conventions as in Figure 1.
Figure 2: Decomposition of TSAM’s international equity strategy active risk
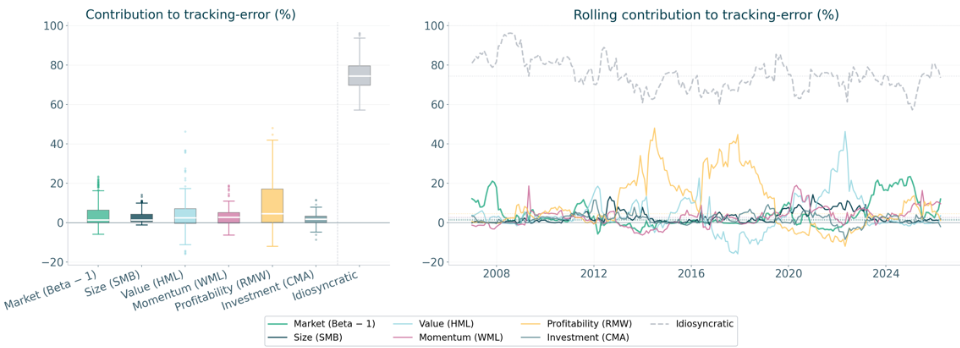
The results indicate that the strategy’s active risk is predominantly idiosyncratic rather than factor driven. Across the sample period, the idiosyncratic component consistently represents the largest share of tracking-error, with a median contribution close to 75%. This suggests that the strategy’s deviations from its benchmark are driven primarily by stock-specific positions rather than by exposures to systematic factors.
Systematic factor contributions remain modest throughout the sample period and only rarely exceed 20% of total tracking error. The main exceptions are temporary increases in the contribution of the profitability factor (RMW) in the middle of the sample period and, to a lesser extent, the value factor (HML) toward the end of the period. It is worth noting that the profitability factor’s contribution remains moderate, despite the higher variability observed in its rolling beta. This demonstrates that fluctuations in estimated factor exposures do not automatically result in proportionally large contributions to active risk, as factor risk contributions also depend on factor volatilities and cross-factor correlations.
This finding appears consistent with TSAM’s style-agnostic investment philosophy, which emphasises a bottom-up approach focused on identifying company-specific structural change.
TSAM’s predominantly idiosyncratic risk profile provides strong diversification benefits relative to peers
One of the highest idiosyncratic risk contributions in the peer universe
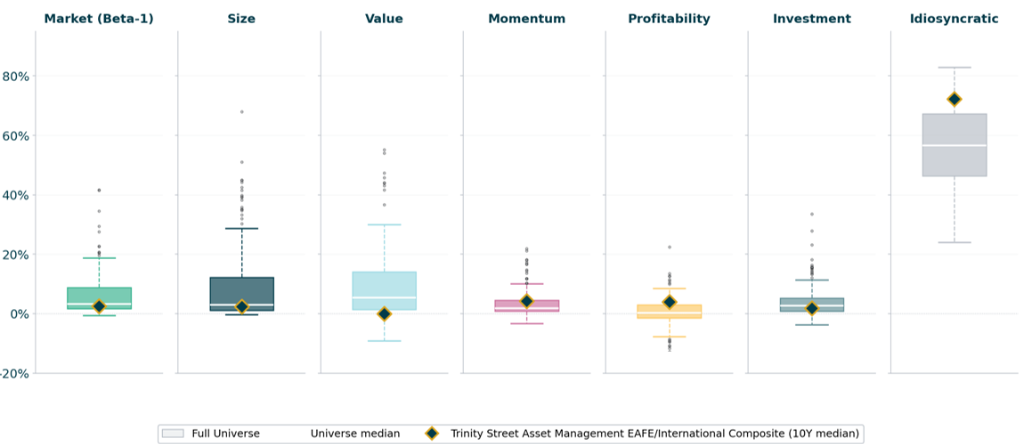
We extend the active risk decomposition analysis performed for TSAM’s strategy to the universe of 181 international equity strategies in the eVestment database (the “eA EAFE Core Equity” universe) with track records available between December 2015 and December 2025. Figure 3 shows the cross-sectional distribution, across peer strategies, of the median contribution of each risk component to tracking error over the 10-year horizon. The results indicate that TSAM’s active risk profile differs materially from that of
its peers. Most notably, the idiosyncratic component of active risk ranks at the 90th percentile of the peer universe (median of 75% for TSAM vs. 57% for the median peer group). This suggests that the strategy relies substantially more on stock-specific positions than the average international equity manager.
Figure 3: Distribution of active risk decompositions across international equity strategies in eVestment database
Strong diversification benefits supported by low and stable pairwise excess return correlations
The higher contribution of idiosyncratic risk in TSAM’s active risk profile relative to peers should translate into stronger diversification benefits. To assess this hypothesis, we calculate for each strategy in the eVestment international equity universe the average median correlation of its excess returns relative to its benchmark with those of all other strategies over the past 10 years (between December 2015 and December 2025). These excess return correlations are computed both unconditionally over the full sample period and conditionally during months of positive or negative factor performance, in order to assess the stability of diversification benefits across different market regimes.
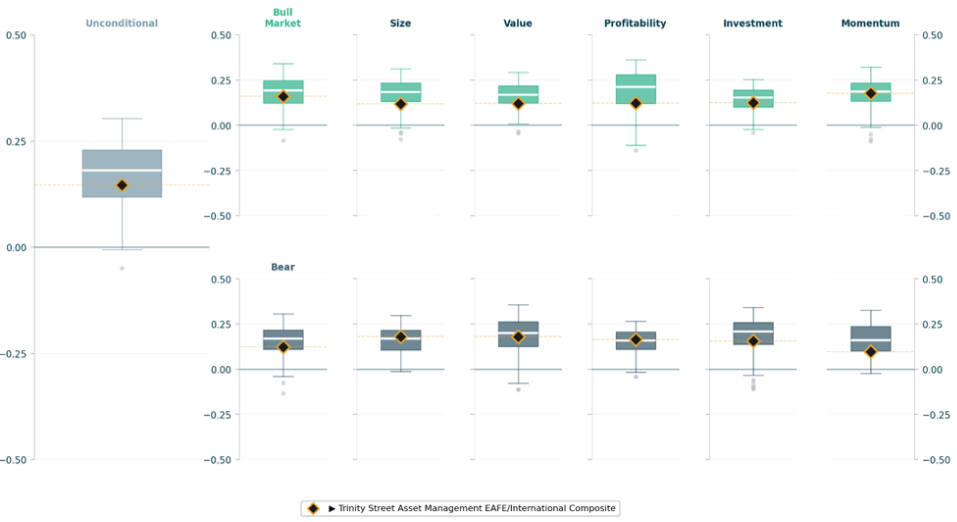
Figure 4 shows the distribution of these average median excess return correlations across peer strategies, together with the corresponding value for TSAM’s strategy (diamonds). TSAM’s average median excess return correlation with other international equity strategies is lower than that of its peers (15% versus 20%). Importantly, TSAM’s excess return correlations remain consistently below those of peers across both positive and negative factor regimes, suggesting that the strategy’s differentiated behavior is not limited to a specific market environment. Particularly noteworthy, the strategy’s average median excess return correlation during bear market periods (17%) remains lower than that during bull market periods (20%), a characteristic that is especially valuable from a diversification perspective.
Figure 4: Distribution of average median pairwise excess return correlations of international equity strategies in the eVestment database
Conclusion
Overall, the empirical evidence appears closely aligned with TSAM’s stated investment philosophy. The strategy’s focus on identifying company-specific under-recognised structural change translates into limited and economically modest exposures to traditional equity factors.
As a result, the strategy’s active risk is driven predominantly by idiosyncratic positions rather than systematic factor exposures. The contribution of idiosyncratic risk to tracking error ranks among the highest within the eVestment international equity universe, highlighting the differentiated nature of the strategy
relative to peers.
This distinctive risk profile also translates into meaningful diversification benefits. TSAM exhibits persistently lower pairwise correlations of excess returns relative to peers across market and factor regimes, suggesting that the strategy may represent a particularly valuable complement within diversified international equity allocations.
Appendix 1
Fama–French–Carhart 6-factor model: A transparent and parsimonious risk framework
The empirical asset-pricing literature has long relied on factor models to break down portfolio risk into a component driven by broad, systematic forces and a component that is specific to individual securities. The starting point is the Capital Asset Pricing Model (“CAPM”) of Sharpe (1964), Lintner (1965) and Mossin (1966), which links expected returns directly to exposure to a single source of systematic risk: the market factor. Although foundational, the CAPM soon proved too narrow to account for the range of systematic influences observed in equity markets.
This led to the development of multi-factor models. Fama and French (1993) introduced size and value as additional systematic dimensions. The size factor (SMB, “Small Minus Big”) is often linked to the greater vulnerability of smaller firms to funding constraints and liquidity shocks. The value factor (HML, “High Minus Low”) is commonly associated with financially distressed or temporarily undervalued companies. As a result, both small-cap and value stocks are perceived as riskier and therefore command higher expected returns. Carhart (1997) then incorporated momentum (UMD, “Up Minus Down”) as an additional source of systematic variation in returns, generally attributed to behavioral effects, such as delayed information diffusion or initial investor underreaction. Fama and French (2015) later expanded the framework to include profitability (RMW, “Robust Minus Weak”) and investment (CMA, “Conservative Minus Aggressive”) factors to capture the tendency of more profitable firms and firms with conservative investment policies to generate higher returns. Collectively, these advances gave rise to the Fama–French–Carhart (“FFC”) 6-factor model.
Over the past three decades, the search for additional factors has intensified. And he who seeks shall find. Academics and practitioners have documented hundreds of new factors. Cochrane (2011) famously described this proliferation as a ‘factor zoo’, highlighting the methodological risk of diluting empirical discipline. Subsequent work confirmed this concern: Harvey, Liu and Zhu (2016) showed that many anomalies fail to survive more stringent statistical thresholds. Feng, Giglio and Xiu (2020) further demonstrated that most newly proposed factors are redundant once tested against a set of established ones. More recently, Bryzgalova, Huang and Julliard (2023) provided evidence that only a small subset of factors carries genuine incremental information.
Commercial risk models are not immune to the dynamics created by this factor proliferation. Because clients often judge a model by how much of a portfolio’s variance it appears to explain, providers face a strong incentive to expand their factor sets: adding more factors mechanically reduces the idiosyncratic component and makes the model look more granular and sophisticated. Yet many of the newly proposed factors are fragile or short-lived. They may seem to explain part of a portfolio’s risk today, only to lose all relevance out of sample and be replaced by another unstable signal tomorrow. This continual rotation of weak factors shrinks the idiosyncratic component by construction, creating the illusion that most risk is systematic while undermining the stability and interpretability of the resulting decomposition.
Accordingly, our analysis relies on a restricted set of long-standing, empirically robust and economically interpretable factors: the Fama–French–Carhart 6-factor model. This framework has become the standard in academic empirical pricing. Although its explanatory power is lower than that of commercial risk models, this is not a limitation for our analysis: what matters is the stability and comparability of the risk decomposition through time and across strategies.
Appendix 2
Kenneth R. French Data Library: A public, transparent and reproducible standard for factor construction
All factors are sourced from the publicly accessible Kenneth R. French Data Library, ensuring full reproducibility and methodological consistency. This widely used academic resource provides factor return series across a wide range of regions, countries, and market-capitalisation segments, drawing on broad universes of publicly listed equities.
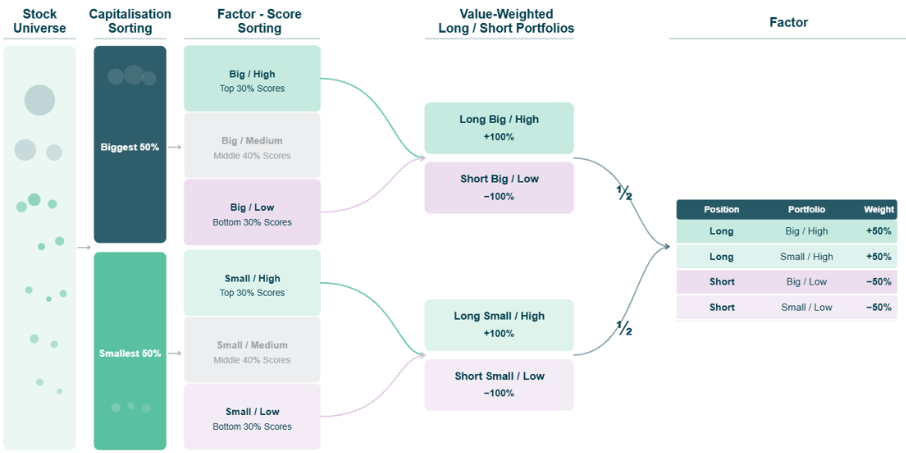
In this framework, the market factor corresponds to a fully invested, value-weighted equity market portfolio financed by borrowing at the risk-free rate. All other factors are constructed as zero-investment portfolios (100% long, 100% short), capturing the return spread between stocks with high and low exposure to a given characteristic underlying each factor. Size is measured by market capitalisation, value by book-to-market ratio, momentum by past twelve-month returns excluding the most recent month, profitability by operating profitability, investment by the growth in total assets.
Each of these characteristics is used in a 2×3 independent sorting procedure. Stocks are first split into two size groups (Small and Big) using the median market capitalisation breakpoint, and into three characteristic groups (Low, Medium, High) using the 30th and 70th percentiles of the cross-sectional distribution. Within each of the six resulting portfolios, returns are value-weighted. Factor returns are then obtained as the difference between the average returns of the High and Low portfolios within each size group, averaged across the two size categories. Portfolios are rebalanced periodically, typically annually for accounting�based characteristics and monthly for momentum.
Appendix 3
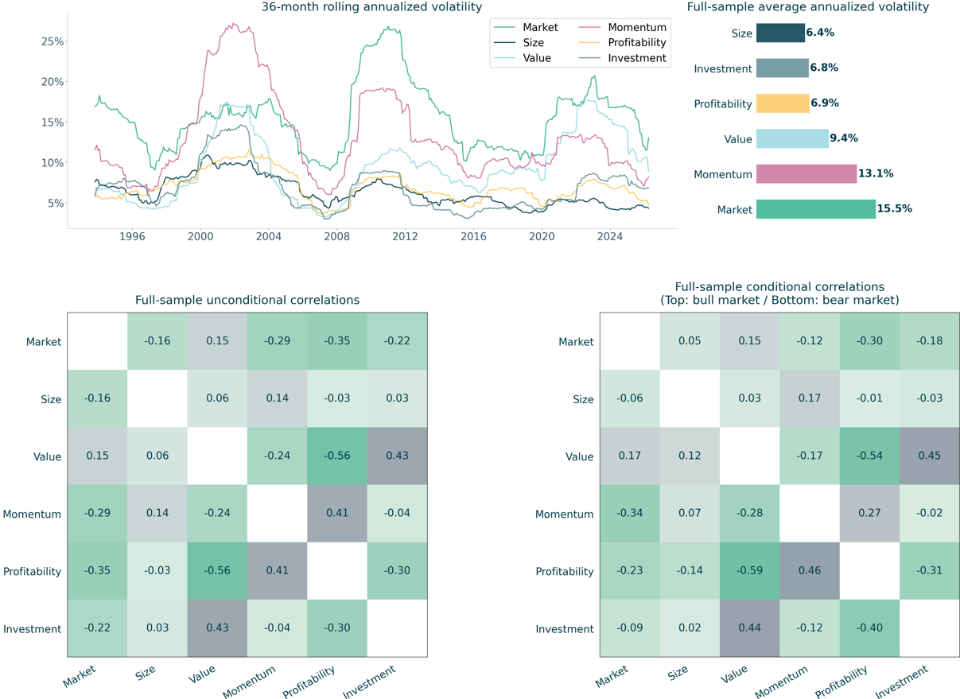
Volatility and correlation structure of Fama-French-Carhart 6-factor model
(Monthly data from November 1990 to December 2025)
Appendix 4
Methodology for active risk decomposition
The decomposition of active risk into systematic factors and idiosyncratic components follows a four-step process based on the Fama–French–Carhart framework.
Step 1 – Calculation of active returns
Monthly active returns are defined as the difference between the strategy’s return and the benchmark
return:
Rtactive = Rtstrategy − Rtbenchmark
These active returns reflect the performance generated by deviations from the benchmark.
Step 2 – Estimation of factor exposures
Active returns are regressed on the returns of the Fama–French–Carhart 6 factors using monthly observations over each rolling 36-month estimation window:
Rtactive = βM · RM,t + βSMB · RSMB,t + βHML · RHML,t + βUMD · RUMD,t + βRMW · RRMW,t + βCMA · RCMA,t + εt
where βi represents the estimated factor exposures (with the market factor being proxied by the
benchmark itself), RM,t is the excess return of the benchmark vs. the risk-free rate, and εt denotes the
residual component.
Step 3 – Decomposition of active variance
Step 3.1. – The systematic component of active variance is estimated as:
σ2systematic = β′ ΣF β
where β denotes the vector of factor exposures and ΣF the covariance matrix of factor returns.
Step 3.2. – Contribution of each factor to active variance is obtained from its marginal contribution:
RCFi = βFi (ΣF β)Fi
where RCFi denotes the contribution of factor i to systematic variance, and (ΣF β)Fi its marginal
contribution to risk.
By construction, factor contributions sum to systematic active variance:
Σi (RCFi) = β′ ΣF β = σ2systematic
Step 3.3. – The idiosyncratic component of active variance is defined as the variance of residuals:
σ2idiosyncratic = Var(ε)
Total active variance is therefore equal to:
σ2active = σ2systematic + σ2idiosyncratic
Step 4 – Normalisation of risk contributions
Factor and idiosyncratic contributions are finally expressed as percentages of total active variance:
RC%Fi = RCFi / σ2active
By construction, the contributions of all systematic factors and idiosyncratic risk sum to 100% of total
active risk for each rolling estimation window.