
Polen Capital Global Growth ETF First Quarter 2026 Commentary
12th May, 2026 | Insight Article

The Polen Capital Global Growth ETF fell 16.11% (NAV return) during the first quarter of 2026, underperforming the MSCI ACWI Index (down 3.20%). The Morningstar Global Large Cap Growth Fund peer group lost 6.79% in the quarter.
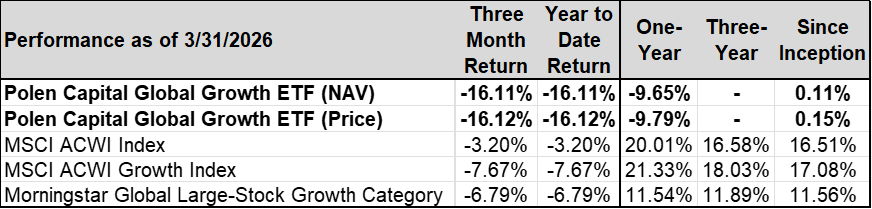
Since Inception: 8/29/2023
Gross Expense Ratio: 0.85% Net Expense Ratio 0.85%
Performance quoted represents past performance and does not guarantee future results. The investment return and principal value of an investment will fluctuate so that an investor’s shares, when redeemed, may be worth more or less than their original cost. Current performance of the funds may be lower or higher than the performance quoted. Short term performance is not a good indication of the fund’s future performance and should not be the sole basis for investing in the fund. To obtain standardized performance of the funds, and performance as of the most recently completed calendar month, please visit www.imgp.com. Returns less than one year are not annualized *There are contractual fee waivers in effect through 4/30/2026.
MSCI index returns source: MSCI. Neither MSCI nor any other party involved in or related to compiling, computing, or creating the MSCI data makes any express or implied warranties or representations with respect to such data (or the results to be obtained by the use thereof), and all such parties hereby expressly disclaim all warranties of originality, accuracy, completeness, merchantability, or fitness for a particular purpose with respect to any of such data. Without limiting any of the foregoing, in no event shall MSCI, any of its affiliates, or any third party involved in or related to compiling, computing, or creating the data have any liability for any direct, indirect, special, punitive, consequential, or any other damages (including lost profits) even if notified of the possibility of such damages. No further distribution or dissemination of the MSCI data is permitted without MSCI’s express written consent.
Commentary
The first quarter of 2026 was a highly volatile one for global equities. Concerns about AI disruption fears reached a fever pitch this quarter and in late February the US and Israel launched Operation Epic Fury in Iran and other nations in the Middle East. These two issues in combination were the primary catalysts for violent moves in stock prices and other asset classes. The best performing sectors in the MSCI ACWI Index (the “Index”), unsurprisingly given the backdrop of war in the Middle East, were Energy, Materials, Utilities, Consumer Staples, Industrials, and Real Estate. While we do, at times, find Consumer Staples and Industrials businesses that meet our investment criteria, in the aggregate, these aren’t sectors that we tend to have much exposure to so their strength was another headwind to our relative performance in the quarter.
For the quarter, the Polen Global Growth ETF (the “Portfolio”) declined -16.11%, while the Index declined -3.20%. While we have made a rather meaningful shift in our exposures in Global Growth during the past year—cutting our software and software adjacent exposures in half and building a significant position in semiconductor and related businesses—we continue to own several enterprise software, internet platform and hyperscaler businesses as well as digital payments companies and proprietary information-based businesses. Many of these companies’ shares have come under pressure from the concerns that generative AI will disrupt their growth, their business models or both. Much of the declines were triggered by new products from Anthropic’s Claude Cowork agentic system that can execute processes for knowledge works autonomously. Indeed, we too see plenty of disruption risk for some businesses that can be replicated better by agentic systems over time especially for software products that are simple and handle low-stakes workloads (don’t need precision), are standalone or point products (not integrated with other systems), have low cost of failure, light regulatory oversight and run on publicly available data. We wouldn’t invest in software businesses like this before generative AI and especially not now. The software (and other information-based) businesses we seek to invest in involve deep systems of record and handle complex, multi-faceted workloads that are embedded in customer environments. They also often have deep domain expertise and stringent regulatory requirements. Replacing these systems would be a complex, hazardous, and a costly exercise that few management teams would be willing to risk. It is worth remembering that generative AI is probabilistic not deterministic, which means the answers it gives are a best guess based on the data set on which it’s been trained. Mistakes and hallucinations that are a natural part of gen AI products cannot be tolerated in mission critical business operations. The competitive advantages of incumbent enterprise software companies are manifold and gen AI coded software cannot easily overcome those advantages, in our view. Contrarily, these embedded enterprise software companies can add AI agents to their existing offerings far easier than AI agents can displace incumbent software. In addition, as agents need access to a company’s mission critical software, the software companies may be able to monetize agentic users just as they do human ones. Companies like Microsoft, ServiceNow, Shopify, Oracle, and CoStar all have multi-layered moats, and, in each case, we see generative AI as a tailwind for their businesses, not a headwind. While we’ve reduced our aggregate software exposure, we added selectively during the quarter to the businesses that we remain most convicted. We’ve also added to platform businesses, like
Meta, Tencent and Spotify, that we feel are successfully applying AI to drive stronger growth and/or do not need to change their business model to continue delivering results.
Amidst this investor panic, it would appear to us that the proverbial ‘baby’ has been ‘thrown out with the bathwater’. Take Microsoft for example, after the quarter’s sell off is now trading at the same valuation (~20x 12 -month forward earnings) as Exxon Mobil despite generating ~4x the amount of operating profit and ~2x the free cash flow (even with Microsoft’s heavy investment into AI infrastructure) and delivering materially higher earnings growth, all with a much greater degree stability and consistency through the cycle. To us, this exemplifies the dichotomy of perception vs. reality.
At the same time, the angst around an AI bubble and the future return from the vast infrastructure investment spend has seen enthusiasm wane for the immediate beneficiaries. Take NVIDIA for example, in their most recent earnings report during the quarter they increased revenues more than 70% year-over-year and delivered meaningful beats on the top and bottom lines, while significantly increasing forward guidance well above consensus estimates. Despite these stellar numbers, the market reaction was one of disinterest as their shares declined post-print and have languished since despite continued evidence showing there seems to be a long runway of outsized future growth ahead for the company. It seems semiconductor investment dollars have moved further, and swiftly, down the supply chain into areas such as memory producers during the quarter, chasing even faster growth as a memory bottleneck is leading to big price increases in this more commoditized segment of the market. During the first half of the first quarter, many software shares were down 30%+ while many memory-related companies shares were up 30%+, a breath-taking move and divergence in a very short period of time.
To us, not only are these two examples astonishing individually, but the narratives driving some software and semiconductor company performance seem to illustrate that psychology and sentiment are increasingly dictating stock performance versus fundamentals and earnings delivery.
Importantly, as earnings reports for the Portfolio’s holdings across these industries have come in during the quarter, they have generally delivered strong operational performance. Revenue growth, customer retention, and cash flow generation remain intact across our holdings in these areas, and we believe the magnitude of share price declines do not reflect an observable change in their intrinsic value.
In the first quarter, we took advantage of the volatility in the marketplace, increasing our exposures to Communication Services platform businesses demonstrating progress applying AI and to semiconductor-related businesses that continue to deliver robust results despite share price declines. While we have reduced our overall exposure to software meaningfully during the past year and slightly more during the first quarter, we have concentrated our software investments in businesses we believe are best positioned to benefit from gen AI tailwinds. The Portfolio’s expected earnings growth remains in the mid-to-high teens range over the coming five years (well above our expectation for the Index’s earnings growth).
Portfolio Performance & Attribution
In Q1 2026, the Portfolio returned -16.11% compared to -3.20% for the Index. Top relative contributors to the Portfolio’s performance included TSMC, Tesla (not owned), and Apple (not owned). By contrast, the largest relative detractors in the quarter were Adyen, Boston Scientific, and CoStar Group.
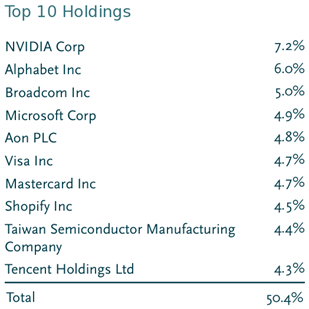
TSMC, the dominant manufacturer of semiconductor chips globally (60% market share), was our top relative and absolute contributor in 1Q. AI -related demand has only continued to grow, contributing to accelerating growth in the first quarter. While NVIDIA is seemingly on a path to overtake Apple as TSMC’s largest customer, TSMC is also benefitting from the growth in custom AI chips (ASICs) as inference and efficiency gains become increasingly important. While the company benefits strongly from the massive amounts of capex the hyperscalers are investing in the AI infrastructure build out, the company itself is investing heavily to maintain its position as the dominant player on the leading -edge advanced nodes (3nm, 5nm) which comes with significant pricing power. While growth can come with a higher degree of cyclicality than most of our companies, through the cycle we expect TSMC should be capable of generating mid -teens revenue growth with modest margin expansion, resulting in high – teens EPS growth.
Adyen was our biggest detractor in the quarter. Adyen is a Netherlands-based operator of a global payments platform, integrating the payment stack along gateway, risk management, processing, acquiring and settlement. We think Adyen’s recent results highlight a company that continues to grow at a healthy pace despite short-term volatility in processed volume. Net revenue growth remains stable at approximately 20%, reflecting continued wallet share gains with enterprise customers. Importantly, there is little evidence that the competitive environment has materially changed since the last major drawdown in the stock. The recent volatility in the stock appears more reflective of sentiment than of any structural change in the underlying business, and as long -term investors we believe this represents an attractive opportunity.
Portfolio Activity
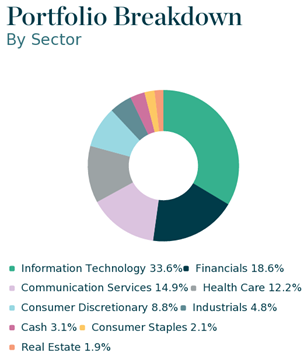
In Q1 2026, we initiated new positions in Siemens Energy, Tokyo Electron, Meta Platforms, and ASML while we sold our holdings in Abbott Laboratories, Adobe, Paycom Software and SAP. We also added to our holdings in Boston Scientific, Spotify, Tencent Holdings, Broadcom, NVIDIA, Shopify, ServiceNow, and CoStar Group, while trimming our exposure to Amazon, Alphabet, MSCI, Oracle, Microsoft, and Siemens Healthineers. The net result of these trades were 1) a lower and more concentrated exposure to software companies, 2) increased exposure to the semiconductor supply chain and 3) increased exposure to platform businesses within Communication Services.
We initiated a new position in Siemens Energy which had spun out of parent Siemens AG in 2020 and is a global energy technology company that manufactures and services the infrastructure that generates, transmits, and stabilizes electricity. The company operates across the full power value chain, including gas and steam turbines, grid transmission equipment, industrial decarbonization solutions, and wind turbines.
The critical growth drivers for Siemens Energy are the Gas Services segment and the Grid Tech segment which comprise 60% by high barriers to entry, but also the potential for cyclical demand, and strong secular tailwinds from data center energy consumption, electrification and grid strengthening. These two segments both have the potential to grow revenues at a double-digit rate over the next 3 years. Overall, we view Siemens Energy as very well positioned over the next few years with the potential for mid-teens or better annual earnings growth.
Tokyo Electron was another new position we added in the quarter. The company is a Japanese leading semiconductor capital equipment vendor that occupies a dominant position in etch, deposition, and wafer cleaning. These are critical steps in the semiconductor manufacturing process and provides the Portfolio with some exposure to the semi – cap equipment industry where the current supply/demand dynamics heavily favor the suppliers. Beyond its meaningful scale advantages, we think Tokyo Electron strategically partners with customers, continuously improves its technologies and is well managed. The company’s main customers include the large foundries (TSMC, Samsung, Intel), but 30-40% of the company revenues come from China as well and this is a market that provides opportunity and risk. Recently both TSMC and Samsung have announced significant increases in capex plans—a big positive for Tokyo Electron. The company has roughly 12% share in the wafer fabrication equipment market and a higher 20% share in the fast-growing (but cyclical) DRAM market. We believe Tokyo Electron is poised to grow total returns at a mid -teens rate over the coming years.
We re-initiated a position in Meta Platforms, a name we previously owned in 2022. While we remain mindful of elevated data center capex and the uncertainty around its ultimate return without a comparable cloud business, we are encouraged by Meta’s strong execution in monetizing AI across its platforms. Advertising revenues are growing at approximately 25% despite already exceeding a $200bn annual run rate, supported by an unparalleled global reach of 3.2bn monthly and 2.2bn daily active users. Although margins are likely to face near-term pressure from continued investment, we expect re-expansion as management balances growth and spending. With the stock trading at ~21x FY26 earnings after a prolonged period of sideways performance, we see an attractive valuation for a business capable of delivering mid-teens EPS growth, with additional upside potential if investment intensity moderates.
Finally, we initiated a small position in ASML, the leading global provider of lithography machines to the semiconductor industry and the only global provider of extreme ultraviolet lithography (EUV) equipment necessary for advanced semiconductor manufacturing. ASML’s machines print minute detail onto silicon wafers. This minute detail is what drives improvement in chip performance, powering technological progress. ASML commands a monopolistic position within its segment of the semi supply chain (in some sub -segments it has 100% market share) and the technological complexity of its equipment creates an enormous barrier to entry. ASML should benefit from the strong semi cycle—both for memory and logic—that we think is likely to persist until the end of the decade. Additionally, recent innovation in light source technology could improve ASML’s machine throughput which would potentially translate into much higher pricing for their machines in the future. Given the various industry tailwinds, we expect ASML should be able to grow earnings at a high-teens rate or better.
On the other hand, we exited our position in Abbott Laboratories during the quarter, following a prior reduction after the company announced its acquisition of Exact Sciences. The size and dilutive nature of the deal raised concerns around capital allocation, which were reinforced by disappointing Q4 results that showed weaker-than-expected organic revenue growth. With business momentum deteriorating and increased uncertainty tied to the acquisition, we believe stepping aside is the prudent course for now. We also sold Adobe, Paycom, and SAP to redeploy the capital to our highest conviction software names like ServiceNow, Shopify and CoStar Group. The previously discussed price dislocations within the software space have presented opportunities for long-term patient investors and we believe it prudent to consolidate some of the portfolio around businesses where we believe the AI disruption concerns are excessive and are unlikely to materially affect their moat. ServiceNow, Shopify and CoStar Group are those types of businesses, in our opinion. These companies are heavily intertwined into their customers’ workflow (and thus difficult to replace), process/house important data and offer their own enhanced AI solutions, and in the case of CoStar Group, have deep domain expertise that we believe would be very difficult to index by AI models. In the case of ServiceNow and Shopify, we believe their respective customers are likely to use their proprietary AI tools rather than try to re-create their own or outsource to an unproven third-party. Both ServiceNow and Shopify are already growing rapidly and we believe have wide open growth potential in enormous markets and AI should be a tailwind for them, and we expect CoStar Group will see significant margin expansion in the coming years that should lead to attractive earnings growth. We expect these three companies to be among the fastest earnings growers in the Portfolio over the next five years.
Outlook
Over the course of our history, there have been numerous periods of narrative-driven volatility that while uncomfortable, ultimately end, as the weight of continuously compounding earnings adds up and proves difficult for market participants to ignore. We are excited about the buying opportunities we are seeing in exceptional businesses that have the potential to deliver above average long -term compounding in the coming years. Our investment process emphasizes underwriting long -term competitive advantages and multi-year earnings power. We remain confident in the attractive long-term compounding potential of our Portfolio holdings compared to the broader market, and we continue to focus on owning businesses with durable advantages, wide economic moats, strong balance sheets, and the ability to grow their earnings over a multi-year horizon. As the weight of our Portfolio’s earnings continues to compound, we believe it will once again prove difficult for market participants to ignore.
Thank you for your interest in Polen Capital and the Global Growth strategy. Please feel free to contact us with any questions or comments.
The funds’ investment objectives, risks, charges, and expenses must be considered carefully before investing. The statutory and summary prospectuses contain this and other important information about the investment company, and it may be obtained by calling 1-800-960-0188, or visiting imgp.com. Read it carefully before investing.
Mutual fund investing involves risk. Principal loss is possible. Past performance does not guarantee future results.
The fund will invest in foreign securities. Investing in foreign securities exposes investors to economic, political and market risks and fluctuations in foreign currencies. Though not a small-cap fund, the fund may invest in the securities of small companies. Small-company investing subjects investors to additional risks, including security price volatility and less liquidity than investing in larger companies. Investments in emerging market countries involve additional risks such as government dependence on a few industries or resources, government-imposed taxes on foreign investment or limits on the removal of capital from a country, unstable government and volatile markets. A value investing style subjects the fund to the risk that the valuations never improve or that the returns on value equity securities are less than returns on other styles of investing or the overall stock market.
The MSCI EAFE Index measures the performance of all the publicly traded stocks in 22 developed non-U.S. markets
The MSCI EAFE Value Index captures large and mid-cap securities exhibiting overall value style characteristics across Developed Markets countries around the world, excluding the US and Canada. With 482 constituents, the index targets 50% coverage of the free float-adjusted market capitalization of the MSCI EAFE Index.
The MSCI World Growth Index captures large and mid-cap securities exhibiting overall growth style characteristics across 23 Developed Markets countries.
The MSCI World Value Index captures large and mid-cap securities exhibiting overall value style characteristics across 23 Developed Markets countries. With 848 constituents, the index targets 50% coverage of the free float-adjusted market capitalization of the MSCI World Index.
Each Morningstar Category Average represents a universe of Funds with similar investment objectives.
You cannot invest directly in an index.
Book value is the net asset value of a company, calculated by subtracting total liabilities from total assets.
Market capitalization (or market cap) is the total value of the issued shares of a publicly traded company; it is equal to the share price times the number of shares outstanding.
Price to earnings ratio (P/E Ratio) is a common tool for comparing the prices of different common stocks and is calculated by dividing the current market price of a stock by the earnings per share. Similarly, multiples of earnings and cash flow are means of expressing a company’s stock price relative to its earnings per share or cash flow per share, and are calculated by dividing the current stock price by its earnings per share or cash per share. Forecasted earnings growth is the projected rate that a company’s earnings are estimated to grow in a future period.
The 10-year Treasury yield is the current rate Treasury notes would pay investors if they bought them today. The 10-year Treasury yield is closely watched as an indicator of broader investor confidence.
Yield Curve: A line that plots the interest rates, at a set point in time, of bonds having equal credit quality, but differing maturity dates. The most frequently reported yield curve compares the three-month, two-year, five-year and 30-year U.S. Treasury debt. The curve is used to predict changes in economic output and growth.
Fund holdings and/or sector allocations are subject to change at any time and are not recommendations to buy or sell any security.
Diversification does not assure a profit nor protect against loss in a declining market.
iM Global Partner Fund Management, LLC has ultimate responsibility for the performance of the iMGP Funds due to its responsibility to oversee the funds’ investment managers and recommend their hiring, termination, and replacement.
The iMGPFunds are distributed by ALPS Distributors, Inc. LGE000580 exp. 12/31/2030