
Polen Capital International Growth ETF First Quarter 2026 Commentary
11th May, 2026 | Insight Article

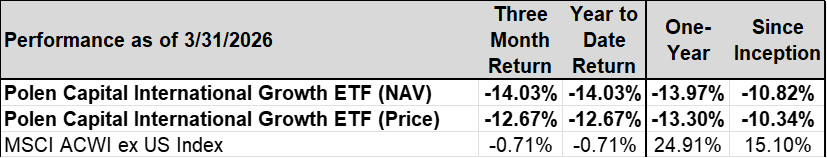
The Polen Capital International Growth ETF fell 14.03% (NAV) during the first quarter of 2026, underperforming the MSCI ACWI ex. Index (down 0.71%).
Since Inception Date: 3/14/2024
Gross Expense Ratio: 0.85% Net Expense Ratio 0.85%
Performance quoted represents past performance and does not guarantee future results. The investment return and principal value of an investment will fluctuate so that an investor’s shares, when redeemed, may be worth more or less than their original cost. Current performance of the funds may be lower or higher than the performance quoted. Short term performance is not a good indication of the fund’s future performance and should not be the sole basis for investing in the fund. To obtain standardized performance of the funds, and performance as of the most recently completed calendar month, please visit www.imgp.com. Returns less than one year are not annualized *There are contractual fee waivers in effect through 4/30/2026.
MSCI index returns source: MSCI. Neither MSCI nor any other party involved in or related to compiling, computing, or creating the MSCI data makes any express or implied warranties or representations with respect to such data (or the results to be obtained by the use thereof), and all such parties hereby expressly disclaim all warranties of originality, accuracy, completeness, merchantability, or fitness for a particular purpose with respect to any of such data. Without limiting any of the foregoing, in no event shall MSCI, any of its affiliates, or any third party involved in or related to compiling, computing, or creating the data have any liability for any direct, indirect, special, punitive, consequential, or any other damages (including lost profits) even if notified of the possibility of such damages. No further distribution or dissemination of the MSCI data is permitted without MSCI’s express written consent.
Commentary
Over the past two years, however, returns have been disappointing as our quality -growth style has faced significant headwinds. As a team, and in my role as portfolio manager, we have spent considerable time analyzing this period and evaluating how best to position the Portfolio going forward. The result is a set of thoughtful adaptations that increase our confidence in the Portfolio. Evolution underpins improvement and resilience, and we are committed to evolving with changing market conditions while remaining grounded in our core principles. Those core principles of concentration, quality, and growth remain unchanged, but we believe our execution can and should improve.
These improvements begin with a renewed emphasis on business quality, including focusing on if each company is operating at its full potential. While even strong businesses experience temporary challenges, we should avoid multi-year headwinds. Secondly, we appreciate that today’s market environment has become more competitive and dynamic. Competitive threats must be taken seriously and dealt with proactively. Lastly, we are placing greater emphasis on balance across geographies and business models, with careful attention to risk and correlations. Ultimately, we believe Portfolio returns should be driven by the strength of the individual businesses we own—companies we expect to compound at attractive rates over many years—rather than by a narrow set of macro or thematic trends. Investors will notice higher-than-average turnover this quarter as we implemented these changes. We expect turnover to moderate and return to historically lower levels in the periods ahead.
Importantly, we continue to see compelling opportunities outside the United States. Many of the world’s leading companies are based internationally, yet for much of the past 15 years they have been underappreciated. While investors began to recognize these opportunities, in 2025, macroeconomic volatility and geopolitical conflict have cut those trends short. We believe trends will reassert themselves as uncertainty declines.
At the same time, the underperformance of quality companies over the past three years has led to more attractive valuations. As a result, we believe high-quality businesses outside the U.S. are offering some of the most compelling opportunities we have seen in years. Today, the Portfolio includes industry leaders across areas such as AI semiconductor manufacturing and equipment, defense technologies, business software, and fintech—many of which are trading at multi-year low valuations.
Investment outcomes are almost never linear. What appears true today may not be so in the future. Periods of underperformance can coincide with the positioning required for future outperformance, and this can only be fully understood with the benefit of hindsight. While recent results have not met our expectations, we believe the changes we have made leave the Portfolio well positioned. We expect the businesses we own to deliver earnings growth in excess of 15% even while trading at attractive valuations. This is a combination that we believe creates a strong foundation for improved performance in the years ahead.
Portfolio Performance & Attribution
In Q1 2026, the Portfolio returned -14.03% compared to -0.71% for the Index. Top relative contributors to the Portfolio’s performance included InPost, ASML Holding, and Disco Corp. By contrast, the largest relative detractors in the quarter were ICON plc, SAP, and Adyen.
Poland-based InPost operates a logistics network featuring 47,000 automated parcel machines (“APM”) and a few other delivery schemes to customers in Poland and parts of western Europe. During the quarter, the stock was up significantly on the announcement of an all- cash takeover offer from a consortium of financial (Advent International, A&R Investments) and strategic (FedEx) investors. The deal is expected to close in the second half of 2026.
ICON plc experienced a significant sell-off in the first quarter driven by an accounting investigation that has revealed accounting errors including potentially revenue overstatements. Specifically, the company announced that its audit committee had launched an internal investigation into accounting practices, with preliminary findings indicating that revenue may have been modestly (less than 2%) overstated in fiscal years 2023 and 2024. Shares immediately sold off 50% on the news and given the nature of this news, we decided to eliminate the position.
Portfolio Activity
Turnover in Q1 2026 was higher than average given some of the changes we implemented across the Portfolio. Specifically, we initiated new positions in TSMC, Rheinmetall, Saab, Mitsubishi Heavy Industries, AstraZeneca, AIA Group, Siemens Energy, Samsung Electronics, and Keyence while we sold our holdings in Nintendo, MakeMyTrip, Adidas, Globant, Amadeus IT Group, Monday.com, ICON plc, and HDFC Bank. We also added and trimmed to a number of existing holdings as well.
TSMC is the dominant manufacturer of semiconductor chips globally with 60% market share. AI-related demand has only continued to grow and while NVIDIA is seemingly on a path to overtake Apple as TSMC’s largest customer, TSMC is also benefitting from the growth in custom AI chips (ASICs) as inference and efficiency gains become increasingly important. While the company benefits strongly from the massive amounts of capex the hyperscalers are investing in the AI infrastructure build out, the company itself is investing heavily to maintain its position as the dominant player on the leading -edge advanced nodes (3nm, 5nm) which comes with significant pricing power. Through the cycle we expect TSMC should be capable of generating mid -teens revenue growth with modest margin expansion, resulting in high -teens EPS growth.
Germany-based Rheinmetall was another new addition in the quarter. We believe that recent military actions in Iran likely prolong the current shortage of ammunition and should lead to strong defense spending for many years to come. We expect Rheinmetall to grow its earnings greater than 20% annualized over the next three years and believe the current valuation is fair.
Sweden-based Saab is a major player in the European defense industry with strong positioning in key products like fighter jets, submarines, rocket launchers, and air defense systems. The company is benefiting from a major increase in demand for defense equipment, as national governments prepare for self-reliance in an increasingly unstable world. Saab should be able to grow revenues at a mid-teens rate in the coming five years and—if it executes well—it should grow EPS in the high teens on the back of margin expansion.
Japan-based Mitsubishi Heavy Industries is a conglomerate which operates across four main business lines: Energy Systems; Plants & Infrastructure; Logistics, Thermal & Drive Systems and Defense. The two most important business lines are its Energy Systems and Defense units which together account for >50% of sales, >75% of profits and >2/3 of future growth. In Energy Systems, the company is a global leader in Gas Turbine Combined Cycle power plants where it benefits from rising power demand related to AI infrastructure. In Defense, Mitsubishi is the largest defense supplier in Japan, typically receiving ~ 30% of the Ministry of Defense’s total equipment spend. Trends in Japan are similar to those globally; defense spend is expected to rise from 2% this year to 3% or greater. New Prime Minister Sanae Takaichi is a big proponent of Japan increasing its defense budget to prepare for a more assertive China. We forecast 25% or greater earnings growth potential through 2030.
UK-based AstraZeneca is a leading global biopharmaceutical company with a robust portfolio of innovative medicines. It has successfully transformed itself following the loss of patents on several drugs in the early 2010s, building a diverse portfolio across oncology, rare diseases, cardiovascular, renal & metabolic diseases, and respiratory & immunology. The product pipeline is particularly impressive in oncology, where it has established a deep portfolio of targeted therapies including anti-body drug conjugates. Also important in the pipeline are drugs for obesity and hypertension. We expect the company to be able to generate low double-digit shareholder returns through 2030.
Another new addition was Hong Kong –based AIA Group, one of the largest life and health insurance groups in Asia. A key competitive advantage is its large tied-agent network, where AIA is widely recognized for the quality and productivity of its agents. We believe AIA is well positioned to benefit from several potential structural tailwinds, including a growing middle class, aging populations, low insurance penetration, and rising health awareness. Looking ahead, we expect high single -digit premium growth and double -digit earnings growth over the next five years.
Samsung Electronics is a large Korean conglomerate with businesses spanning semiconductors, consumer electronics, displays, and audio systems. The semiconductor division is by far the most important, accounting for more than 50% of revenue and roughly 90% of profits. Importantly, Samsung is the only semiconductor manufacturer capable of producing both logic and memory at scale. In theory, this provides a structural advantage: tighter integration between logic and memory can improve power delivery, thermal management, and signal communication, enabling better performance and faster design cycles. While Samsung has not fully capitalized on this advantage historically, AI presents a potential opportunity, particularly as high-bandwidth memory (HBM) becomes more tightly integrated with logic chips.
Keyence is a Japan-based global leader in industrial laser sensors and machine vision systems used in manufacturing. Its sensors enable in-line automation of measuring, scanning, identification, and quality control tasks that were typically performed by humans two decades ago. Increasingly, Keyence’s technology is also being integrated into industrial robots for applications such as picking & packing and robotic vision. Revenue growth has slowed in recent years, largely due to weakness in the global auto industry, which accounts for roughly 25% of sales. While it may be too early to call a full recovery, auto demand appears to be stabilizing. At the same time, other end markets such as semiconductors and machine tools are beginning to recover. We believe it is only a matter of time before revenue growth re-accelerates to the low double digits, which we view as sustainable in the medium term.
Germany-based Siemens Energy is one of the three dominant manufacturers of gas turbines for power generation, alongside GE Vernova and Mitsubishi Heavy Industries. We believe Siemens Energy is well positioned to benefit from rising electricity demand driven by AI, which is likely to spur significant investment in new power generation capacity. In addition, the company has a leading electricity transmission equipment business that should also benefit from this structural increase in energy demand. While Siemens Energy’s wind business has been a significant drag on profitability in recent years, performance appears to be stabilizing and improving. As these issues are addressed, we expect the company’s earnings power to become more fully reflected in its results. Overall, we believe Siemens Energy can deliver earnings growth of over 20% annually over the next five years.
On the other hand, our sales of Nintendo, MakeMyTrip, Adidas, Globant, Amadeus IT Group, Monday.com, ICON plc, and HDFC Bank were driven by a number of different factors, but all with the aim of upgrading the quality of the Portfolio given the aforementioned opportunities.
Outlook
Over the course of Polen Capital’s history, there have been numerous periods of narrative-driven volatility that while uncomfortable, ultimately end, as the weight of continuously compounding earnings adds up and proves difficult for market participants to ignore. We are excited about the buying opportunities we are seeing in exceptional businesses that have the potential to deliver above average long-term compounding in the coming years.
Our investment process emphasizes underwriting long-term competitive advantages and multi -year earnings power. We remain confident in the attractive long-term compounding potential of our Portfolio holdings compared to the broader market, and we continue to focus on owning businesses with durable advantages, wide economic moats, strong balance sheets, and the ability to grow their earnings over a multi-year horizon. As the weight of our Portfolio’s earnings continues to compound, we believe it will once again prove difficult for market participants to ignore.
Thank you for your interest in Polen Capital and the International Growth strategy. Please feel free to contact us with any questions or comments.
The funds’ investment objectives, risks, charges, and expenses must be considered carefully before investing. The statutory and summary prospectuses contain this and other important information about the investment company, and it may be obtained by calling 1-800-960-0188, or visiting imgp.com. Read it carefully before investing.
Mutual fund investing involves risk. Principal loss is possible. Past performance does not guarantee future results.
The fund will invest in foreign securities. Investing in foreign securities exposes investors to economic, political and market risks and fluctuations in foreign currencies. Though not a small-cap fund, the fund may invest in the securities of small companies. Small-company investing subjects investors to additional risks, including security price volatility and less liquidity than investing in larger companies. Investments in emerging market countries involve additional risks such as government dependence on a few industries or resources, government-imposed taxes on foreign investment or limits on the removal of capital from a country, unstable government and volatile markets. A value investing style subjects the fund to the risk that the valuations never improve or that the returns on value equity securities are less than returns on other styles of investing or the overall stock market.
The MSCI EAFE Index measures the performance of all the publicly traded stocks in 22 developed non-U.S. markets
The MSCI EAFE Value Index captures large and mid-cap securities exhibiting overall value style characteristics across Developed Markets countries aroundthe world, excluding the US and Canada. With 482 constituents, the index targets 50% coverage of the free float-adjusted market capitalization of the MSCI EAFE Index.
The MSCI World Growth Index captures large and mid-cap securities exhibiting overall growth style characteristics across 23 Developed Markets countries.
The MSCI World Value Index captures large and mid-cap securities exhibiting overall value style characteristics across 23 Developed Markets countries. With 848 constituents, the index targets 50% coverage of the free float-adjusted market capitalization of the MSCI World Index.
Each Morningstar Category Average represents a universe of Funds with similar investment objectives.
You cannot invest directly in an index.
Book value is the net asset value of a company, calculated by subtracting total liabilities from total assets.
Market capitalization (or market cap) is the total value of the issued shares of a publicly traded company; it is equal to the share price times the number of shares outstanding.
Price to earnings ratio(P/E Ratio) is a common tool for comparing the prices of different common stocks and is calculated by dividing the current market price of a stock by the earnings per share. Similarly, multiples of earnings and cash flow are means of expressing a company’s stock price relative to its earnings per share or cash flow per share, and are calculated by dividing the current stock price by its earnings per share or cash per share. Forecasted earnings growth is the projected rate that a company’s earnings are estimated to grow in a future period.
The 10-year Treasury yield is the current rate Treasury notes would pay investors if they bought them today. The 10-year Treasury yield is closely watched as an indicator of broader investor confidence.
Yield Curve: A line that plots the interest rates, at a set point in time, of bonds having equal credit quality, but differing maturity dates. The most frequently reported yield curve compares the three-month, two-year, five-year and 30-year U.S. Treasury debt. The curve is used to predict changes in economic output and growth.
Fund holdings and/or sector allocations are subject to change at any time and are not recommendations to buy or sell any security.
Diversification does not assure a profit nor protect against loss in a declining market.
iM Global Partner Fund Management, LLChas ultimate responsibility for the performance of the iMGP Funds due to its responsibility to oversee the funds’ investment managers and recommend their hiring, termination, and replacement.
The iMGPFunds are distributed by ALPS Distributors, Inc. LGE000578 exp. 12/31/2030