
iMGP Berkshire Dividend Growth ETF First Quarter 2026 Commentary
20th May, 2026 | Insight Article

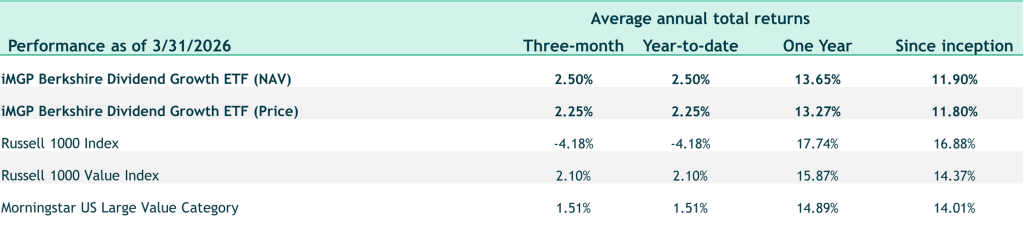
The iMGP Berkshire Dividend Growth ETF returned 2.50% (NAV return) in the first quarter of 2026 compared to 2.10% for the Russell 1000 Value Index. The Morningstar U.S. Large Value category had a return of 1.51% over the same period.
Gross Expense Ratio: 0.55% Net Expense Ratio 0.55%
Since Inception Date: 6/29/2023
Performance quoted represents past performance and does not guarantee future results. The investment return and principal value of an investment will fluctuate so that an investor’s shares, when redeemed, may be worth more or less than their original cost. Current performance of the funds may be lower or higher than the performance quoted. Short term performance is not a good indication of the fund’s future performance and should not be the sole basis for investing in the fund. To obtain standardized performance of the funds, and performance as of the most recently completed calendar month, please visit http://www.imgp.com/. Returns less than one year are not annualized. You may pay a commission to purchase an ETF.
Shares of any ETF are bought and sold at market price (not NAV), may trade at a discount or premium to NAV and are not individually redeemed from the Fund. Brokerage commissions will reduce returns.
Quarterly Portfolio Manager Commentary
2026 is off to a wild start—to say the least! We will unpack the year’s events soon enough, but we believe dividend stocks “passed the test” again. We continue to see their combination of steady cash flow, generally strong balance sheets and reasonable valuations looking to provide solid downside protection in a volatile market.
How Did 2026 Unfold, and Where Do We Go From Here?
It’s been anything but a straight line, and the headline index numbers don’t tell the whole story.
Act I: Too Much Enthusiasm
Early 2026 picked up where 2025 left off—investors were infatuated with growth investing and the latest tech paradigm. AI names were being stuffed into everything: indexes, “value” funds, moderate allocation models. The market was beginning to broaden after a massive AI-driven run, but crowding in mega-cap tech and AI remained very real.
Act II: The Quiet Rotation
Then, without much fanfare, things started to shift. Value stocks began to rally. Energy, staples, industrials, and materials posted double-digit returns through the end of February. Lower valuation international stocks continued their upward pace. Value peaked, up ~7% the Friday before Iranian airstrikes began, while growth was down ~5% over the same period. The growth selloff—fueled by a rotation out of frothy AI and mega-cap growth and jitters in private credit—appeared to just be getting underway. (Source: Bloomberg)
Act III: Iran—And the Plot Twist Nobody Scripted
On February 28th, strikes on Iran sparked the ongoing conflict. Oil jumped above $100. The threat of sustained high prices pushed stagflation concerns to the forefront, and the 10 -year Treasury surged from 3.95% to over 4.40%. The dollar strengthened as inflation control became a priority, removing an easy-money tailwind. A stronger dollar, in turn, pressured international stocks that had been benefiting from rising local prices and currency appreciation.
Sector Reaction
Predictably, the oil and energy sector led the quarter, rising 30-40%. Utilities, a classic defensive sector, held up well but face potential headwinds from higher interest rates. Consumer defensive stocks, which were strong before the strikes, faltered later in the quarter amid fears of sticky inflation, rising input costs, and soft demand. They still ended positive for the quarter.
Technology stocks were hit hard, with several tech names down 20% or more. High starting valuations played a role, but the bigger factor has been AI-driven disruption, particularly from companies like Anthropic. AI is beginning to automate core functions across software, consulting, and data services—tasks these companies built entire businesses around. In many ways, the software industry has almost “invented” a toolset that now threatens to devour its own market.
Financials, a top-performing sector last year, struggled this quarter. Geopolitical uncertainty and recession fears contributed, but the bigger factor has been the proliferation of private credit. Over the past years, hedge funds and other non-bank lenders have stepped in to fund everything from LBOs to working capital, often with looser underwriting. While some see these non-bank entities as an efficient capital source, others worry loans are being made to borrowers who wouldn’t meet traditional bank standards. High-profile failures have raised questions: What are the underlying loans worth? Is there enough transparency? Was capital simply deployed to generate sponsor fees? This $1.5-$2 trillion question will need resolution regardless of the market outcome.
Berkshire Dividend Strategy: Company Highlights
Some holdings mirrored broader sector trends—our energy positions and defense-related holdings rose sharply. Others were shaped by individual company developments.
The portfolio saw numerous dividend increases in the past three months: Dell (+20%), Schwab (+18%), Waste Management (+14.5%). Pepsi, Chevron, Chubb, and Walmart raised dividends 4-6%. Appreciation was notable from Hershey (lower input costs), Honeywell (successful spin-off), and Deere (increasing recurring revenue versus equipment sales). (Source: Bloomberg)
Conversely, some companies faced unique headwinds. Qualcomm, down roughly 24%, struggled with memory supply and diversification. Microsoft, down roughly 23%, faced valuation pressure amid a technology rotation. Abbott Labs issued weak guidance. General Mills wrestled with higher input costs and soft demand. (Source: Bloomberg)
So, What Do You Do with All of This?
We cannot predict whether the Iran conflict will be short-lived or prolonged, and we won’t try to handicap it. We continue to advise investors to remain invested in high-quality businesses that can compound capital even in difficult environments—especially those paying dividends. The income machine doesn’t stop because headlines are loud. Companies that write checks every quarter—and raise them—are exactly the businesses built for this environment. We remain laser-focused on upgrading portfolio companies for the long term and will look to use volatility to our advantage.
So, What Do You Do with All of This?
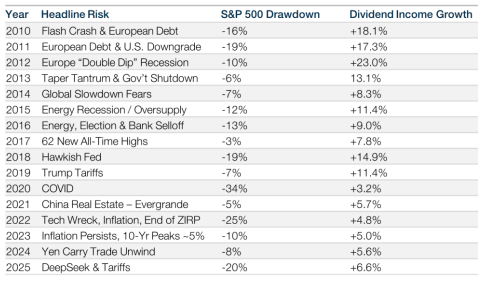
Q1 ’26 is a reminder of what’s been true for some time… Every year brings a new reason to sit on the sidelines. This chart pairs each year’s headline risk with the market’s worst drawdown—and shows how Berkshire’s dividend income grew through it all.
| Industrials | 18.1% |
| Information Technology | 17.7% |
| Financials | 16.6% |
| Consumer Staples | 11.3% |
| Energy | 10.3% |
| Health Care | 9.6% |
| Consumer Discretionary | 6.0% |
| Materials | 3.6% |
| Utilities | 3.0% |
The funds’ investment objectives, risks, charges, and expenses must be considered carefully before investing. The statutory and summary prospectuses contain this and other important information about the investment company, and it may be obtained by calling 1-800-960-0188, or visiting imgp.com. Read it carefully before investing.
Mutual fund investing involves risk. Principal loss is possible. Past performance does not guarantee future results.
The fund will invest in foreign securities. Investing in foreign securities exposes investors to economic, political and market risks and fluctuations in foreign currencies. Though not a small-cap fund, the fund may invest in the securities of small companies. Small-company investing subjects investors to additional risks, including security price volatility and less liquidity than investing in larger companies. Investments in emerging market countries involve additional risks such as government dependence on a few industries or resources, government-imposed taxes on foreign investment or limits on the removal of capital from a country, unstable government and volatile markets. A value investing style subjects the fund to the risk that the valuations never improve or that the returns on value equity securities are less than returns on other styles of investing or the overall stock market.
The MSCI EAFE Index measures the performance of all the publicly traded stocks in 22 developed non-U.S. markets
The MSCI EAFE Value Index captures large and mid-cap securities exhibiting overall value style characteristics across Developed Markets countries around the world, excluding the US and Canada. With 482 constituents, the index targets 50% coverage of the free float-adjusted market capitalization of the MSCI EAFE Index.
The MSCI World Growth Index captures large and mid-cap securities exhibiting overall growth style characteristics across 23 Developed Markets countries.
The MSCI World Value Index captures large and mid-cap securities exhibiting overall value style characteristics across 23 Developed Markets countries. With 848 constituents, the index targets 50% coverage of the free float-adjusted market capitalization of the MSCI World Index.
Each Morningstar Category Average represents a universe of Funds with similar investment objectives.
You cannot invest directly in an index.
Book value is the net asset value of a company, calculated by subtracting total liabilities from total assets.
Market capitalization (or market cap) is the total value of the issued shares of a publicly traded company; it is equal to the share price times the number of shares outstanding.
Price to earnings ratio (P/E Ratio) is a common tool for comparing the prices of different common stocks and is calculated by dividing the current market price of a stock by the earnings per share. Similarly, multiples of earnings and cash flow are means of expressing a company’s stock price relative to its earnings per share or cash flow per share, and are calculated by dividing the current stock price by its earnings per share or cash per share. Forecasted earnings growth is the projected rate that a company’s earnings are estimated to grow in a future period.
The 10-year Treasury yield is the current rate Treasury notes would pay investors if they bought them today. The 10-year Treasury yield is closely watched as an indicator of broader investor confidence.
Yield Curve: A line that plots the interest rates, at a set point in time, of bonds having equal credit quality, but differing maturity dates. The most frequently reported yield curve compares the three-month, two-year, five-year and 30-year U.S. Treasury debt. The curve is used to predict changes in economic output and growth.
Fund holdings and/or sector allocations are subject to change at any time and are not recommendations to buy or sell any security.
Diversification does not assure a profit nor protect against loss in a declining market.
iM Global Partner Fund Management, LLC has ultimate responsibility for the performance of the iMGP Funds due to its responsibility to oversee the funds’ investment managers and recommend their hiring, termination, and replacement.
The iMGPFunds are distributed by ALPS Distributors, Inc. LGE000577 exp. 3/31/30