
Polen Capital China Growth ETF First Quarter 2026 Commentary
11th May, 2026 | Insight Article

The Polen Capital China Growth ETF fell 8.68% (NAV return) in the first quarter of 2026, trailing the MSCI China All Shares Index (down 6.52%).
| 3 Months | YTD | 1 Year | Since Inception | |
| Polen Capital China Growth ETF (Nav) | -8.68% | -8.68% | 1.54% | 11.35% |
| Polen Capital China Growth ETF (Price) | -6.70% | -6.70% | 3.39% | 12.49% |
| MSCI China All Shares Index | -6.52% | -6.52% | 10.36% | 17.63% |
Since Inception Date: 3/14/2024
Expense Ratio: 1.00%
Performance quoted represents past performance and does not guarantee future results. The investment return and principal value of an investment will fluctuate so that an investor’s shares, when redeemed, may be worth more or less than their original cost. Current performance of the funds may be lower or higher than the performance quoted. Short term performance is not a good indication of the fund’s future performance and should not be the sole basis for investing in the fund. To obtain standardized performance of the funds, and performance as of the most recently completed calendar month, please visit www.imgp.com. Returns less than one year are not annualized. You may pay a commission to purchase an ETF.
MSCI index returns source: MSCI. Neither MSCI nor any other party involved in or related to compiling, computing, or creating the MSCI data makes any express or implied warranties or representations with respect to such data (or the results to be obtained by the use thereof), and all such parties hereby expressly disclaim all warranties of originality, accuracy, completeness, merchantability, or fitness for a particular purpose with respect to any of such data. Without limiting any of the foregoing, in no event shall MSCI, any of its affiliates, or any third party involved in or related to compiling, computing, or creating the data have any liability for any direct, indirect, special, punitive, consequential, or any other damages (including lost profits) even if notified of the possibility of such damages. No further distribution or dissemination of the MSCI data is permitted without MSCI’s express written consent. Source note: Returns prior to 1999 are the MSCI ACWI ex-US GR index. Returns from 1999 onwards are MSCI ACWI ex-US NR index.
Shares of any ETF are bought and sold at market price (not NAV), may trade at a discount or premium to NAV and are not individually redeemed from the Fund. Brokerage commissions will reduce returns.
Quarterly Portfolio Manager Commentary
Chinese equity markets, as measured by the MSCI China All Shares Index (the “Index”), declined during the quarter.
Risk appetite was shaped by a combination of global geopolitical uncertainty, AI-related sentiment swings, and China’s policy and macro signals. Global markets weakened after Israel and U.S. strikes on Iran on 28 February and subsequent retaliation across the Gulf region. Investors focused on the Strait of Hormuz, through which a meaningful share of global oil and gas supply typically transits, as threats of disruption contributed to a sharp move higher in energy prices. Beyond energy, markets also became more sensitive to potential knock-on effects on critical inputs such as aluminum and helium, both relevant to industrial and technology supply chains. These dynamics raised concerns around inflation, interest-rate expectations, and global growth should the conflict prove prolonged.
At the same time, technology and AI remained an important driver of sentiment. After strong performance in parts of the technology complex, markets saw periods of de-risking tied to concerns around AI valuations, the pace of monetization, and shifting views on capex intensity. Even so, multiple indicators cited by market participants continued to point to strong underlying AI demand and tight computing resources in China.
On the domestic policy front, China’s Two Sessions concluded during the quarter and helped anchor expectations. Authorities reiterated priorities around technological self-reliance, consumption support, and risk prevention, while refraining from announcing large-scale incremental stimulus. Incoming early-year data points were viewed as broadly supportive by many investors, though debate persisted around sustainability given ongoing property headwinds and the role of front-loaded fiscal support.
Portfolio Performance & Attribution
Sector allocation, a result of our bottom-up stock selection, detracted from relative returns, driven primarily by our underweight in Materials and overweight in Communication Services. Security selection also detracted, with the largest selection headwinds coming from Communication Services and Consumer Discretionary.
On individual stocks, relative performance was mainly supported by Contemporary Amperex Technology (CATL) (+10.6%), Montage Technology (+48.5%) and AIA Group (+5.4%) during the quarter.
CATL is a key beneficiary of the electrification and energy‑storage mega‑trend, underpinned by its global No.1 positions in EV batteries (38% share) and ESS batteries (36% share). During the quarter, the stock was supported by a strong 4Q print (revenue +37%, recurring net profit +63%) alongside full utilization, reinforcing confidence in near‑term momentum. Looking ahead, management commentary points to continued strength in storage and reiterated a 20–30% volume CAGR ambition through 2030E. The broader energy‑security backdrop also provides supportive long‑run tailwind for storage deployment.
Montage Technology is a leading fabless semiconductor company focused on high-performance interconnect chips that help regulate and accelerate data transmission in servers (including AI servers). It is the largest memory interconnect chip vendor globally, operating in a relatively consolidated market alongside a small number of key peers. As AI computing grows, servers require higher memory capacity and bandwidth, which supports continued upgrades in Montage’s core products and creates a runway for newer interconnect solutions. In addition, its PCIe-related interconnect products have been gaining traction, particularly in China, providing another growth leg beyond its traditional server memory interface chips. During the quarter, we switched our holdings from the A‑share line to the newly listed Hong Kong line, which debuted in February at a discount to the A‑share line and subsequently traded at a premium, contributing positively to performance.
AIA’s business continues to see positive outlook. The company delivered a strong FY25 result, with New Business Value (NBV) up 17% and Embedded Value (EV) up 11%, and management guided to 20%+ NBV growth in Mainland China for the first two months of 2026. Earnings momentum also remained healthy, with net free surplus generation up 11% and operating profit after tax (OPAT) up 8%, while the solvency ratio eased to 221%, which we still view as a solid level. Finally, shareholder returns continued to improve: AIA proposed a final DPS of 144.08 Hong Kong cents (+10% YoY) and announced a US$1.7bn buyback program for 2026 (US$0.7bn recurring plus US$1.0bn additional).
On the other hand, Tencent Music (-46.5%), Trip.com (-31.8%) and NetEase (-20.3%) were key detractors.
Tencent Music is the leading online music and audio entertainment platform in China. The stock declined sharply during the quarter as investors weighed competitive and business-model transition risks, even though the company reported solid 4Q25 results. The earnings release showed double-digit growth in online music services and subscription revenue, and strong growth in non-subscription businesses. However, the market is focused on rising competition (including rapid user growth at emerging platforms such as ByteDance’s Soda Music), as well as uncertainty around how the industry evolves amid AI-driven changes.
Trip.com is the dominant online travel agency (OTA) in China. The stock fell during the quarter primarily due to regulatory overhang after the company became subject to an anti-monopoly investigation by China’s State Administration for Market Regulation (SAMR). While the company delivered decent operating results, the regulatory uncertainty — combined with broader market concern on AI’s impact on software and OTA business – weighed on sentiment and led to share price pressure.
NetEase is one of the leading video game developers in China, supported by strong in-house R&D and a pipeline of upcoming titles. During the quarter, however, the stock was pressured by concerns about potential tax changes, including discussion around VAT treatment for games and the sustainability of high-tech (HNTE) preferential tax status. Besides, there has been broader market debate on whether advances in AI “world models” (such as Genie 3) could lower barriers to content creation and reshape the competitive landscape for game developers, even though management teams and experts generally frame near-term impact as more about productivity tools than immediate disruption.
Portfolio Activity
During the period, we initiated new positions in Horizon Robotics, H World Group, Pop Mart, and Foshan Haitian Flavouring, and added to Baidu. These purchases were funded by trimming selected existing holdings and exiting Zhejiang Supor (a tail position). For Montage Technology, we also switched from the A-share line to its Hong Kong listing, which IPO’d at a discount.
We initiated a position in Horizon Robotics, a key enabler of advanced driving features. While near-term China auto demand remains soft, we see structural growth in higher-level ADAS (advanced driver assistance) and NOA (navigate-on-autopilot) adoption over the next five years. Horizon provides automotive SoCs (system-on-a-chip—the vehicle’s main computing chip) plus an integrated software stack with attractive price-to-performance. Supported by extensive OEM/Tier-1 relationships and localization tailwinds, we expect rising penetration, market share gains and higher content per vehicle (e.g., Journey 6P / SuperDrive) to drive rapid growth and a clearer path to profitability.
H World is a strong operator in China, in our view, with best-in-class operating metrics such as occupancy and attractive economics for franchisees. Its large membership base and high direct-booking mix are key advantages, while its diverse brand portfolio enables it to capture demand across segments. We also see industry conditions improving: industry RevPAR (revenue per available room) turned positive in 4Q25 and indicators point to slowing supply growth. Demand has been resilient, supported by a shift toward experiential consumption, policy support for services consumption, rising inbound travel (including more visa-free arrangements), and growing travel demand from the “silver generation.”
Pop Mart is China’s largest pop‑toy company with a growing global footprint. We started a small position as we expect near‑term growth to remain strong. Capacity expansion has improved product availability and should help sales shift from secondary resale channels back toward official stores. After the recent share‑price pullback, valuation also looked less stretched, while we remain mindful that long‑term visibility will continue to be an important debate for the market.
Foshan Haitian Flavouring is China’s leading condiment company, with a long‑established brand and a broad product portfolio (including soy sauce and oyster sauce) supported by an extensive distribution network. We started a small position as we see a recovery path supported by Haitian’s brand strength and ongoing execution in channels and product/category expansion, while monitoring the pace and sustainability of demand normalization. The trade was paired with an exit from Zhejiang Supor, which could face sales pressure in the near-term under fading trade-in subsidies and rising material costs could impact margins.
There are multiple drivers pulling Baidu in different directions. AI will continue to have an impact on Baidu’s advertising business, albeit with a lower base. On the other hand, AI has propelled growth for its cloud business, while its Kunlun AI chip business will likely gain traction as China moves towards domestic AI chip particularly for inferencing. Its robotaxi business is leading in China. Net cash (USD22bn as of the end of 3Q25) and investment on balance sheet serves as a cushion. The company is also becoming more aware of enhancing shareholder value through capital management and spinning off business units (e.g. Kunlun) to crystalize value.
Outlook
We expect equity performance in 2026 to be driven primarily by earnings growth rather than the valuation expansion. In this environment, market returns are likely to look more “normalized,” with upside increasingly stock specific rather than broad based. Against that backdrop, we see selective opportunities in China. In particular, companies at the forefront of innovation— for example, those building scalable, monetizable AI-enabled business models and those leading in advanced manufacturing—appear well positioned to benefit from China’s distinctive ecosystem. On the consumption side, policy efforts aimed at unlocking household savings and stimulating domestic demand should be supportive for brands that can respond to evolving consumer preferences and consistently deliver higher-quality goods and services.
Near term, we expect volatility to persist as investors weigh a complex mix of competing forces. Several constructive factors are providing support, including government measures intended to stabilize growth, accelerating domestic development and adoption of AI and related technologies, and healthy liquidity inflows from both local and international investors. At the same time, periodic shifts in global risk appetite—including those driven by geopolitical and energy-related uncertainty—contribute to market swings, even when the longer‑term fundamentals remain intact.
Within this setting, our approach remains centered on selective, high-quality businesses with durable competitive advantages, proven and sustainable business models, strong balance sheets, capable management teams, and a clear alignment with shareholders. We believe these characteristics improve a company’s ability to navigate external uncertainty while preserving the resilience needed to compound value over the long term. As China continues its economic transition, we believe the types of companies we target can sustain double-digit growth. In our view, the domestic market offers a broad and attractive opportunity set supported by long-term structural drivers such as continued technological advancement and improving capability of Chinese companies.
Thank you for your interest in Polen Capital and the China Growth strategy. Please feel free to contact us with any questions.
The Funds’ investment objectives, risks, charges, and expenses must be considered carefully before investing. The statutory and summary prospectuses contain this and other important information about the investment company, and it may be obtained by calling 1-800-960-0188, or visiting imgp.com. Read it carefully before investing.
Mutual fund investing involves risk. Principal loss is possible. Past performance does not guarantee future results.
The fund will invest in foreign securities. Investing in foreign securities exposes investors to economic, political and market risks and fluctuations in foreign currencies. Though not a small-cap fund, the fund may invest in the securities of small companies. Small-company investing subjects investors to additional risks, including security price volatility and less liquidity than investing in larger companies. Investments in emerging market countries involve additional risks such as government dependence on a few industries or resources, government-imposed taxes on foreign investment or limits on the removal of capital from a country, unstable government and volatile markets. A value investing style subjects the fund to the risk that the valuations never improve or that the returns on value equity securities are less than returns on other styles of investing or the overall stock market.
The MSCI EAFE Index measures the performance of all the publicly traded stocks in 22 developed non-U.S. markets
The MSCI EAFE Value Index captures large and mid-cap securities exhibiting overall value style characteristics across Developed Markets countries around the world, excluding the US and Canada. With 482 constituents, the index targets 50% coverage of the free float-adjusted market capitalization of the MSCI EAFE Index.
The MSCI World Growth Index captures large and mid-cap securities exhibiting overall growth style characteristics across 23 Developed Markets countries.
The MSCI World Value Index captures large and mid-cap securities exhibiting overall value style characteristics across 23 Developed Markets countries. With 848 constituents, the index targets 50% coverage of the free float-adjusted market capitalization of the MSCI World Index.
Each Morningstar Category Average represents a universe of Funds with similar investment objectives.
You cannot invest directly in an index.
Book value is the net asset value of a company, calculated by subtracting total liabilities from total assets.
Market capitalization (or market cap) is the total value of the issued shares of a publicly traded company; it is equal to the share price times the number of shares outstanding.
Price to earnings ratio (P/E Ratio) is a common tool for comparing the prices of different common stocks and is calculated by dividing the current market price of a stock by the earnings per share. Similarly, multiples of earnings and cash flow are means of expressing a company’s stock price relative to its earnings per share or cash flow per share, and are calculated by dividing the current stock price by its earnings per share or cash per share. Forecasted earnings growth is the projected rate that a company’s earnings are estimated to grow in a future period.
The 10-year Treasury yield is the current rate Treasury notes would pay investors if they bought them today. The 10-year Treasury yield is closely watched as an indicator of broader investor confidence.
Yield Curve: A line that plots the interest rates, at a set point in time, of bonds having equal credit quality, but differing maturity dates. The most frequently reported yield curve compares the three-month, two-year, five-year and 30-year U.S. Treasury debt. The curve is used to predict changes in economic output and growth.
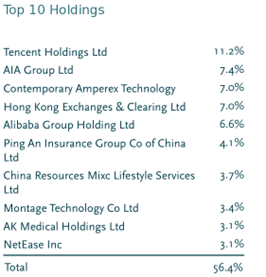
Fund holdings and/or sector allocations are subject to change at any time and are not recommendations to buy or sell any security.
Diversification does not assure a profit nor protect against loss in a declining market.
iM Global Partner Fund Management, LLC has ultimate responsibility for the performance of the iMGP Funds due to its responsibility to oversee the funds’ investment managers and recommend their hiring, termination, and replacement.
The iMGPFunds are distributed by ALPS Distributors, Inc. LGE000579 exp. 12/31/2030